Z-Score line Daily/Weekly# Z-Score Line Daily/Weekly
**A forward-projected linear regression z-score that measures how far current price has deviated from where its statistical trend *expects* it to be — turning regression residuals into a normalized mean-reversion oscillator.**
---
## What It Does
Z-Score Line computes a linear regression with a configurable forward offset, then measures the residual distance between current price and that projected regression line, normalized by the standard deviation of non-offset regression residuals. The result is a statistically grounded oscillator where readings beyond ±2σ represent historically rare deviations from the projected trend. A smoothed moving average overlay provides momentum context — rising MA confirms z-score direction, divergences flag potential reversals. The forward offset is the key differentiator: rather than measuring deviation from the *current* best-fit line (which always passes near recent price), it measures deviation from where the trend *was heading*, making it structurally better at identifying overshoot conditions.
---
## Theoretical Foundations
- **Linear regression residual analysis** — OLS residuals measure the component of price unexplained by the linear trend; standardizing by residual σ converts this to a z-score with known statistical properties under normality assumptions
- **Forward-projected regression (offset parameter)** — Projecting the regression line forward by `offset` bars creates a "where price should be" reference, rather than a retrospective best-fit; deviations from this projection identify trend exhaustion and overshoot
- **Z-score normalization** — Dividing residuals by their rolling standard deviation produces a unit-free oscillator where ±1σ, ±2σ, ±3σ levels carry standard probabilistic interpretation (68/95/99.7 under Gaussian assumptions — wider in practice for fat-tailed crypto returns)
- **Smoothed z-score as momentum filter** — The SMA of the z-score acts as a second-order trend confirmation, analogous to a signal line on MACD; slope direction separates impulsive moves from mean-reverting ones
---
## Signals
**Bullish:**
- Z-score crosses above zero → price has moved above its projected regression, trend bias shifting positive
- Z-score crosses below lower threshold (−4.7) → extreme negative overshoot, potential mean-reversion long entry
- Z-score MA turning green (rising) while z-score is positive → confirmed bullish momentum
**Bearish:**
- Z-score crosses below zero → price has fallen below its projected regression, trend bias shifting negative
- Z-score crosses above upper threshold (+5.1) → extreme positive overshoot, potential mean-reversion short entry or profit-taking
- Z-score MA turning red (falling) while z-score is negative → confirmed bearish momentum
**Neutral / Caution:**
- Z-score near zero with flat MA → price tracking projected regression, no actionable deviation
- Z-score and MA diverging (z-score rising, MA falling or vice versa) → signal conflict, reduce conviction
---
## Oscillator Pane Fields
| Plot | Description | Range |
|------|-------------|-------|
| **Z-Score** | Standardized residual from forward-projected linear regression (green = positive, red = negative) | Unbounded (typically ±6) |
| **Z-Score MA** | SMA of z-score (green when rising, red when falling) | Same scale as z-score |
| **Upper Line** | Static upper extreme threshold | +5.1 (default) |
| **Lower Line** | Static lower extreme threshold | −4.7 (default) |
| **Zero Line** | Trend-neutral reference | 0 |
---
## Key Inputs
| Input | Default | Guidance |
|-------|---------|----------|
| **Timeframe** | D | Daily is the primary design target. Weekly smooths signals for swing/position trading. Both apply to the regression computation — chart timeframe is independent. |
| **Linear Regression Length** | 21 | Lookback for OLS fit. 21 ≈ one trading month. Shorter (10–14) increases sensitivity to recent moves; longer (30–50) captures broader trend structure. Affects both the offset projection and residual σ. |
| **Linear Regression Offset** | 30 | Forward projection distance in bars. 30 bars on daily ≈ 1.5 months ahead. This is the core parameter — higher offset creates a more "stale" reference line, amplifying deviation signals. Reduce to 10–15 for faster mean-reversion signals; increase to 40–60 for identifying macro-scale overshoot. |
| **Z-Score MA Length** | 13 | SMA smoothing period for the momentum overlay. 13 ≈ half the regression length. Shorter (5–8) tracks z-score more closely; longer (21+) filters noise but lags direction changes. |
---
## Data Sources & request.security() Budget
| Symbol | Purpose | Calls |
|--------|---------|-------|
| Chart symbol (`close`) | All regression, residual, and z-score computations | 0 |
**Total request.security() usage: 0 of 40.** The indicator operates entirely on the current chart's close data with no external security calls, making it fully compatible as a companion pane alongside request.security()-heavy indicators. The Timeframe input uses TradingView's built-in `input.timeframe()` resolution override, not `request.security()`.
---
## Alerts
| Alert | Trigger | Use Case |
|-------|---------|----------|
| **Z-Score Crosses Above Zero** | `ta.crossover(zscore, 0)` | Trend bias flips positive — potential long entry or short exit |
| **Z-Score Crosses Below Zero** | `ta.crossunder(zscore, 0)` | Trend bias flips negative — potential short entry or long exit |
| **Z-Score Crosses Above Upper Line** | `ta.crossover(zscore, 5.1)` | Extreme positive overshoot — mean-reversion short or profit-taking zone |
| **Z-Score Crosses Below Lower Line** | `ta.crossunder(zscore, -4.7)` | Extreme negative overshoot — mean-reversion long or capitulation signal |
All alerts fire via `alertcondition()` (static presets). Alerts trigger on **bar close only** for the selected timeframe resolution — no intra-bar repainting.
---
## Important Notes
- **Anti-repainting:** All computations use `close` (confirmed bar data). The `ta.linreg()` offset parameter projects the regression line forward but does not use future data — it extrapolates the regression slope computed from the trailing `length` bars. No `request.security()` calls, no `barmerge.lookahead_on`, no future data references.
- **Offset interpretation:** The offset does *not* look ahead. It computes the regression from the most recent `length` bars, then evaluates where that line would be `offset` bars in the future. The residual measures current price vs. that extrapolated point. This means the z-score is structurally biased: when trends persist, the offset projection undershoots; when trends reverse, it overshoots. This is the intended behavior for mean-reversion detection.
- **Asymmetric thresholds:** The default upper (+5.1) and lower (−4.7) thresholds are asymmetric, reflecting empirical BTC behavior where downside deviations tend to be sharper but shorter-lived than upside overextensions. Calibrate these to your asset — use the v2 adaptive mode (percentile-based thresholds) for automatic adjustment.
- **Recommended timeframes:** Daily (primary), Weekly (swing). The 21-bar regression on daily captures ~1 month of structure. On 4H, the same 21-bar length captures only 3.5 days — reduce offset proportionally or switch to Weekly resolution via the Timeframe input.
- **Asset scope:** Designed for BTC and major crypto pairs. The z-score normalization assumes roughly stationary residual variance — works on any liquid asset with sufficient history (>50 bars minimum for regression warmup). Not calibrated for low-liquidity altcoins where gap behavior distorts regression fits.
インジケーター

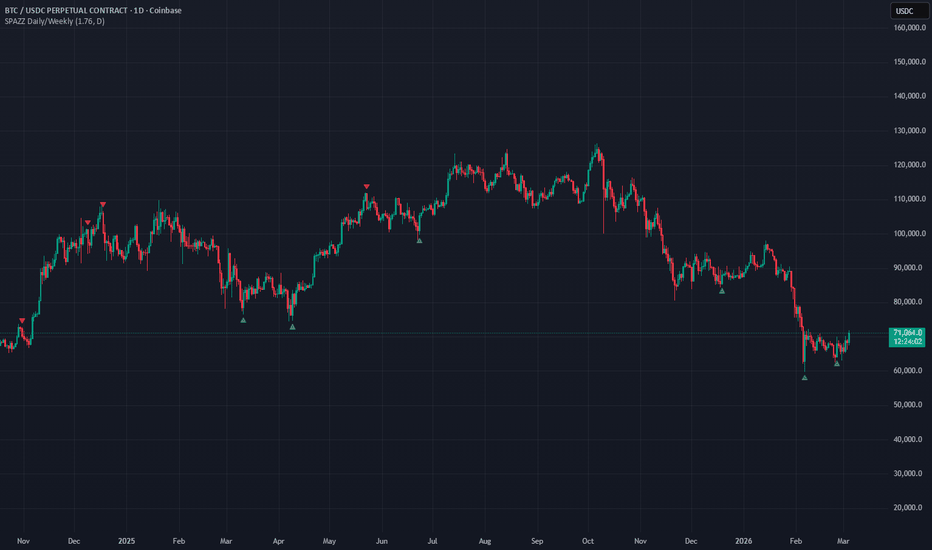
SPAZZ Daily/Weekly# SPAZZ Daily/Weekly (SFI)
**A mean-reversion entry filter that combines RSI z-score zero-crossings with Bollinger Band touch-and-reclaim — triggering only when momentum normalization and price envelope reversion agree on the same bar.**
---
## What It Does
SPAZZ SFI computes a z-score of RSI(14) by subtracting its 14-period SMA and dividing by its 14-period standard deviation, then gates entries on the z-score crossing zero coinciding with price crossing back inside a Bollinger Band (20-period, 1.76σ default). The dual-gate design filters out standalone BB touches that lack momentum confirmation and standalone RSI recoveries that haven't reached envelope extremes. Signals only fire when both conditions align on the same bar — a conjunction filter that materially reduces false positives relative to either component alone.
---
## Theoretical Foundations
- **Bollinger Bands (Bollinger, 1983)** — Price envelope defined as SMA(20) ± kσ. The non-standard default multiplier of 1.76σ (vs. the typical 2.0σ) widens the signal zone, capturing reversion setups before price reaches full 2σ extension — a deliberate sensitivity tradeoff
- **RSI z-score normalization** — Raw RSI is bounded and non-stationary across regimes. Z-scoring against its own rolling distribution converts it to a zero-centered, approximately unit-variance series where zero-crossings represent transitions from below-mean to above-mean momentum (and vice versa), independent of the prevailing RSI level
- **Conjunction filtering** — Requiring two independent conditions to fire simultaneously on the same bar exploits the low joint probability of co-occurrence under noise. If each condition fires independently with probability *p*, the conjunction fires with probability ≈ *p²* under independence — geometrically reducing false signal rates
---
## Signals
**Bullish (BUY):**
- RSI z-score crosses above zero (momentum recovering from below-average) **AND** price crosses above the lower Bollinger Band (reclaiming the envelope from below)
- Interpretation: price was extended to the downside and is now showing simultaneous mean-reversion in both price level and momentum — a high-probability long entry zone
**Bearish (SELL):**
- RSI z-score crosses below zero (momentum deteriorating from above-average) **AND** price crosses below the upper Bollinger Band (failing to hold the upper envelope)
- Interpretation: price was extended to the upside and is now losing momentum while falling back inside the band — a high-probability short entry or exit zone
**No Signal:**
- Z-score crosses zero but price is mid-band → momentum shift without envelope extremity
- Price touches a band but z-score doesn't cross zero → envelope touch without confirmed momentum reversal
---
## Overlay Fields
| Plot | Description |
|------|-------------|
| **Up Triangle** | Green triangle below bar on BUY signal |
| **Down Triangle** | Red triangle above bar on SELL signal |
| **BUY Label** | Optional text label at low of signal bar |
| **SELL Label** | Optional text label at high of signal bar |
No Bollinger Band lines are plotted (overlay remains clean). The BB computation is internal to the signal logic only.
---
## Key Inputs
| Input | Default | Guidance |
|-------|---------|----------|
| **BB Multiplier** | 1.76 | Controls band width. Lower values (1.5–1.7) increase signal frequency by catching shallower pullbacks. Higher values (2.0–2.5) require deeper extension before triggering — fewer but more extreme signals. The 1.76 default sits between standard (2.0) and aggressive (1.5). |
| **Show Labels** | On | Toggle BUY/SELL text labels. Disable for cleaner charts when using alerts instead of visual scanning. |
| **Timeframe** | D | Selector for Daily or Weekly. **Note:** This input is declared but not wired to `request.security()` in the current version — the indicator runs on the chart's native timeframe regardless of this setting. |
---
## Data Sources & request.security() Budget
**Total request.security() usage: 0 of 40.** All computations use the chart's native timeframe and symbol. No external data calls.
---
## Alerts
| Alert | Trigger | Frequency |
|-------|---------|-----------|
| **BUY** | RSI z-score crosses above 0 AND close crosses above lower BB | Once per bar close |
| **SELL** | RSI z-score crosses below 0 AND close crosses below upper BB | Once per bar close |
Both alerts use `alertcondition()` — static presets configured in TradingView's alert dialog. No dynamic `alert()` calls.
---
## Important Notes
- **Anti-repainting:** All computations use `close`, `ta.crossover()`, and `ta.crossunder()` on confirmed bar data. No `request.security()` calls, no lookahead. Signals are fixed once the bar closes.
- **Timeframe input is cosmetic:** The `input.timeframe()` selector is present in the UI but not connected to any MTF logic. The indicator always runs on the chart's native timeframe. To analyze Daily signals on a Weekly chart (or vice versa), change the chart timeframe directly.
- **BB multiplier sensitivity:** At the default 1.76σ, bands are ~12% tighter than standard 2.0σ Bollinger Bands. This means signals fire more frequently but at less extreme price levels. If you observe excessive false signals, increase toward 2.0–2.2.
- **RSI z-score warmup:** The z-score requires 2× RSI_LENGTH bars (28 bars) to stabilize — 14 for the RSI series itself and 14 for its rolling mean and standard deviation. Signals within the first ~30 bars of chart history are unreliable.
- **Conjunction is strict:** Because both conditions must co-occur on the exact same bar, signal frequency is low. On daily BTC charts, expect roughly 2–6 signals per month depending on regime. This is by design — it is an entry filter, not a continuous scoring system. インジケーター
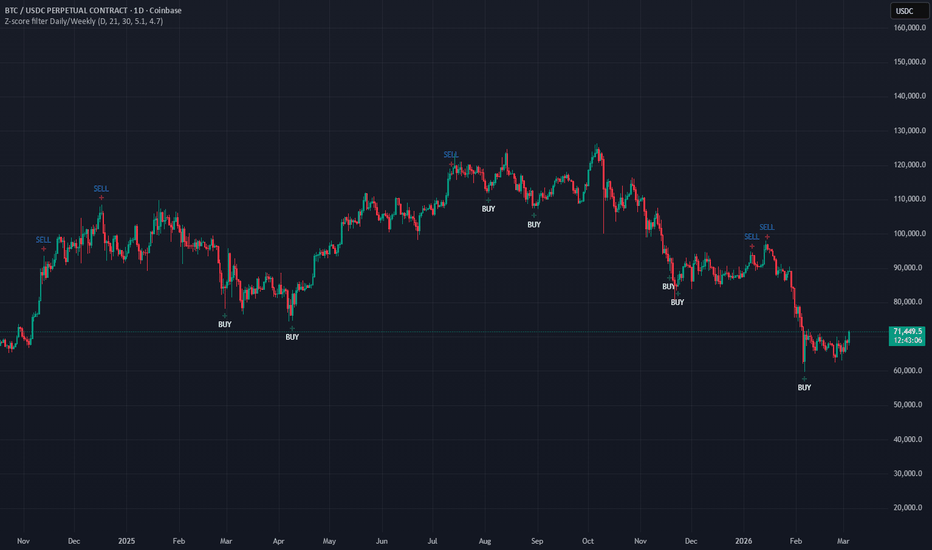
Z-score filter Daily/Weekly# Z-Score Filter — Daily / Weekly
**Identifies statistically extreme price dislocations from a linear regression trend using a standardized residual z-score, firing high-precision mean-reversion entries at historically rare extremes.**
---
## What It Does
Fits a linear regression to `close` over a configurable lookback and offset, then standardizes the residual of current price against that trend using a rolling standard deviation — producing a classical z-score of price deviation. Signals fire when the z-score crosses back through extreme upper or lower thresholds (default: ±5.1 / ±4.7), identifying price dislocations far enough into the tail distribution to represent genuine mean-reversion opportunity rather than noise. The offset parameter decouples the regression anchor from the current bar, eliminating the lookahead that plagues most regression-based overlays.
---
## Theoretical Foundations
- **Ordinary Least Squares (linear regression):** Minimizes squared residuals to produce a best-fit price trend; `ta.linreg(close, length, offset)` with non-zero offset is non-repainting by design.
- **Standardized residuals / z-scores:** Residual normalized by the rolling standard deviation of `close`; values beyond ±3σ are statistically rare under a normal distribution (~0.3% frequency), making the default thresholds (4.7–5.1σ) extremely selective.
- **Mean-reversion in financial time series:** Grounded in error-correction dynamics — when price overshoots its equilibrium trend, restoring forces (liquidity, arbitrage, position unwinds) tend to pull it back. High σ thresholds act as a filter for only the most dislocated conditions.
- **Signal polarity:** Crossover (z-score rising back through −lower) = **bullish** (price recovering from extreme negative dislocation). Crossunder (z-score falling back through +upper) = **bearish** (price rolling over from extreme positive dislocation).
---
## Signals
| Signal | Condition | Interpretation |
|---|---|---|
| 🟢 **Deep Value (BUY)** | `zscore` crosses **above** `−lower` threshold | Price has been at extreme negative residual and is reverting toward trend — mean-reversion long entry |
| 🔴 **Over Value (SELL)** | `zscore` crosses **below** `+upper` threshold | Price has been at extreme positive residual and is rolling back toward trend — mean-reversion short/exit entry |
| ⬜ **No Signal** | `zscore` inside threshold band | Price within statistically normal range relative to trend; no actionable dislocation |
---
## Key Inputs
| Input | Default | Type | Guidance |
|---|---|---|---|
| **Timeframe** | `D` | Dropdown (D / W) | `D` for swing entries; `W` for position-sizing filter or macro regime context. MTF security call pulls higher-TF data cleanly. |
| **Linear Regression Length** | `21` | Integer | Controls the lookback window for trend fitting and σ estimation. Shorter (10–15) = more responsive, noisier. Longer (34–55) = slower, fewer signals but higher quality. |
| **Linear Regression Offset** | `30` | Integer | Shifts the regression anchor back N bars, ensuring the fitted value at bar is based on historical data only — critical for anti-repainting. Do not set to 0. |
| **Plot Linear Regression Line** | `true` | Boolean | Toggle the blue regression overlay. Disable to reduce chart clutter when stacking indicators. |
| **Upper Threshold** | `5.1` | Float | Bearish trigger level (σ above trend). Increase to 5.5–6.0 on higher-volatility assets (altcoins, meme coins). |
| **Lower Threshold** | `4.7` | Float | Bullish trigger level (σ below trend, stored as positive value, applied as negative). Slightly lower than upper to account for the well-documented negative skew in crypto. |
**Threshold calibration guidance:** On BTC/ETH at daily resolution, 4.7–5.1σ yields 1–4 signals per year — true tail events. Reduce to 3.0–4.0 for higher-frequency assets or 4H charts with the understanding that signal quality degrades.
---
## Dashboard / Visual Elements
| Visual Element | Description |
|---|---|
| **Blue line (Linear Regression)** | Best-fit OLS trend over `length` bars, anchored `offset` bars back. Toggleable. |
| **Green cross + "BUY" label (below bar)** | Deep Value signal — z-score crossover through `−lower` |
| **Red cross + "SELL" label (above bar)** | Over Value signal — z-score crossunder through `+upper` |
*No dashboard table. This is an overlay-only signal indicator — no separate pane required.*
---
## Data Sources
| Source | Ticker / Field | Usage |
|---|---|---|
| Chart symbol | `close`, `volume` | Primary price series and volume (built-in, no `request.security()` calls) |
**`request.security()` budget:** **0 calls.** This indicator uses only the native chart series. The timeframe input switches chart context via the timeframe parameter on `ta.linreg` — note that standard Pine Script indicators do not auto-request the selected TF; for true MTF operation, a companion wrapper using `request.security()` is needed.
---
## Alerts
| Alert Name | Trigger | Suggested Use |
|---|---|---|
| **Deep Value** | `zscore` crosses above `−lower` | Long entry watchlist — confirm with volume or funding rate context before execution |
| **Over Value** | `zscore` crosses below `+upper` | Short entry / long exit watchlist — higher false-positive rate in strong trends; use regime filter |
Both alerts use `alertcondition()` (static presets). Compatible with TradingView webhook delivery to execution systems.
---
## Important Notes
**Anti-repainting:** The non-zero `offset` (default: 30) is the critical anti-repainting mechanism. The regression is evaluated at `bar_index - offset`, meaning it is computed entirely from historical bars at the time it fires. **Do not set offset to 0** — this creates lookahead bias where the regression re-fits to include the current bar, causing historical signals to shift position on replay. The signal shapes (`plotshape`) are plotted on confirmed close data.
**Recommended timeframes:** Daily and Weekly. The default thresholds (4.7 / 5.1σ) are calibrated for daily BTC/ETH behavior. On intraday charts, reduce thresholds significantly or the indicator will rarely trigger. Can be used on any timeframe.
**Asset scope:** Optimized for crypto majors (BTC, ETH, SOL, XRP). Apply cautiously to high-beta altcoins — the σ distribution has fatter tails, so fixed thresholds will be hit more frequently and signal quality degrades. Consider switching to adaptive percentile-based thresholds (97th/95th percentile of rolling |z|) for non-major assets.
**Signal frequency expectation:** At default settings on BTCUSD daily, expect 1–5 signals per year. This is intentional — these are designed as high-conviction tail-event entries, not a frequent signal system.
**Trend vs. mean-reversion regime:** This indicator performs best in ranging / oscillating markets. In strong directional trends, "Deep Value" signals may be sequentially triggered as price continues lower — always context-check against a trend/regime classifier before trading mechanically.
インジケーター
Polynomial Regression Moving Average (PRMA)1. WHAT IS PRMA?
PRMA is a non-repainting, smoothed moving average that uses the endpoint of polynomial regression as its core value. It generalizes the classic Linear Regression Moving Average (LSMA) to any polynomial degree — including fractional values — and adds a comprehensive multi-method, multi-iteration smoothing layer on top.
In Simple Terms
PRMA fits a mathematical curve (polynomial) to recent price history, takes the last point of that curve as the current value, then optionally smooths the result using your choice of 9 different smoothing algorithms — applied up to 10 times in sequence.
2. CORE ARCHITECTURE
text
┌─────────────────────────────────────────────────────┐
│ PRMA PIPELINE │
│ │
│ Price Data ──► Polynomial Regression ──► Endpoint │
│ (OLS with degree d) Extraction │
│ │ │
│ ▼ │
│ Raw PRMA Value │
│ │ │
│ ▼ │
│ Smoothing Layer │
│ (Method × Iterations)│
│ │ │
│ ▼ │
│ Final PRMA Output │
│ │ │
│ ▼ │
│ Signal Generation │
│ (Direction Change) │
└─────────────────────────────────────────────────────┘
3. MATHEMATICAL FOUNDATION
3.1 Polynomial Regression (OLS)
For the last n bars, a polynomial of degree d is fitted:
text
ŷ(x) = β₀ + β₁x + β₂x² + ... + βₐxᵈ
The coefficients are solved via the Normal Equation:
text
β = (XᵀX)⁻¹ · Xᵀ · y
Where X is the Vandermonde matrix:
text
X = | 1 0 0² ... 0ᵈ |
| 1 1 1² ... 1ᵈ |
| 1 2 2² ... 2ᵈ |
| . . . ... . |
| 1 n-1 (n-1)² ... (n-1)ᵈ |
3.2 The Weight Kernel (Efficiency Innovation)
Instead of solving full regression every bar, a fixed weight kernel is precomputed once:
text
Kernel K = x_last · (XᵀX)⁻¹ · Xᵀ
Where x_last =
Then each bar simply computes:
text
PRMA_raw = Σ K × price for i = 0 to n-1
This is a constant-time weighted sum — extremely efficient.
3.3 Fractional Degree Interpolation
For degree = 3.7:
text
kernel_3 = compute_kernel(degree=3)
kernel_4 = compute_kernel(degree=4)
final_kernel = 0.3 × kernel_3 + 0.7 × kernel_4
This allows infinitely fine-grained control over responsiveness.
3.4 Smoothing Layer
The raw PRMA value passes through a selectable smoothing function, applied iteratively:
text
smoothed₁ = smooth(raw_PRMA)
smoothed₂ = smooth(smoothed₁)
smoothed₃ = smooth(smoothed₂)
...
smoothedₙ = smooth(smoothedₙ₋₁)
Each iteration further reduces noise while adding controlled lag.
4. ALL PARAMETERS EXPLAINED
4.1 Core Parameters
Parameter Default Range Description
Source close Any price The price data fed into the regression
Period 100 ≥ 2 Number of bars in the regression lookback window
Degree 4.0 ≥ 1.0 (step 0.1) Polynomial degree — controls curve complexity
4.2 Color Parameters
Parameter Default Description
Up Green rgb(36,223,23) PRMA line color when rising
Down Fuchsia PRMA line color when falling
4.3 Smoothing Parameters
Parameter Default Range Description
Smoothing Method EMA 10 options Type of smoothing filter applied
Smoothing Length 5 ≥ 1 Lookback for the smoothing algorithm
Smoothing Iterations 1 1–10 Number of sequential smoothing passes
4.4 Signal Parameters
Parameter Default Description
Show Signals true Toggle buy/sell labels on chart
5. SMOOTHING METHODS IN DETAIL
5.1 Complete Smoothing Method Comparison
Method Formula Concept Lag Smoothness Best For
None No smoothing Zero Raw Fastest response, noisy
SMA Equal-weight average High Moderate Simple baseline smoothing
EMA Exponential decay Medium Good General purpose
WMA Linear weight decay Medium Good Recent-data emphasis
RMA Wilder's smoothing High Very High Ultra-smooth trending
HMA Hull method Low Good Low-lag smoothing
DEMA Double EMA Low Good Lag reduction
TEMA Triple EMA Very Low Moderate Minimum lag
VWMA Volume-weighted mean Medium Good Volume-aware smoothing
Gaussian Bell-curve kernel Medium Excellent Natural, artifact-free
5.2 Smoothing Method Formulas
text
SMA(n) = (P₁ + P₂ + ... + Pₙ) / n
EMA(n) = α × P + (1-α) × EMA_prev where α = 2/(n+1)
WMA(n) = (n×P₁ + (n-1)×P₂ + ... + 1×Pₙ) / (n×(n+1)/2)
RMA(n) = (1/n) × P + (1 - 1/n) × RMA_prev
HMA(n) = WMA(√n, 2×WMA(n/2) - WMA(n))
DEMA(n) = 2×EMA(n) - EMA(EMA(n))
TEMA(n) = 3×(EMA - EMA²) + EMA³
VWMA(n) = Σ(P×V) / Σ(V)
Gaussian(n) = Σ(P × e^(-0.5×(i/σ)²)) / Σ(e^(-0.5×(i/σ)²))
where σ = n/3
5.3 Multi-Iteration Effects
text
Iterations: 1 2 3 4+
│ │ │ │
Noise: Low Very Low Minimal Near Zero
Lag: Low Moderate Higher Highest
Shape: Sharp Rounded Very Round Gaussian-like
Iterations Equivalent Behavior
1 Standard single-pass filter
2 Similar to Butterworth 2nd-order
3 Approaching Gaussian response
4+ Ultra-smooth, trend-only extraction
6. SIGNAL LOGIC
6.1 Direction Detection
text
PRMA Rising → prma > prma → Bullish
PRMA Falling → prma < prma → Bearish
6.2 Buy Signal (Long — "L")
text
Conditions (ALL must be true):
✅ PRMA turns UP (was falling on previous bar, now rising)
✅ Close > PRMA (price confirms above the moving average)
✅ Show Signals ON
Displayed as: Green "L" label below the bar
6.3 Sell Signal (Short — "S")
text
Conditions (ALL must be true):
✅ PRMA turns DOWN (was rising on previous bar, now falling)
✅ Close < PRMA (price confirms below the moving average)
✅ Show Signals ON
Displayed as: Fuchsia "S" label above the bar
6.4 Signal Flow Diagram
text
PRMA Direction
│
┌─────────┴──────────┐
▼ ▼
Rising Falling
│ │
│ Was Falling? │ Was Rising?
│ │ │ │
▼ ▼ ▼ ▼
Yes No Yes No
│ └── No Signal │ └── No Signal
│ │
▼ ▼
Close > PRMA? Close < PRMA?
│ │
Yes ──► BUY "L" Yes ──► SELL "S"
No ──► No Signal No ──► No Signal
7. NON-REPAINTING GUARANTEE
Why PRMA Never Repaints
Factor Explanation
Fixed kernel Weight matrix computed once on first bar, never recalculated
Fixed lookback Each bar uses exactly length bars ending at length bars ago
No future data Uses source through source — all confirmed
Deterministic smoothing All smoothing methods are causal (backward-looking only)
One value per bar Once a bar closes, its PRMA value is permanently locked
Important Note
The indicator uses source check, meaning the PRMA value is plotted with a length-bar delay from the source data. This ensures that ALL input data is from closed, confirmed bars — the ultimate non-repainting guarantee.
Repainting vs Non-Repainting Comparison
text
REPAINTING Polynomial Regression Channel:
Bar 100: Draws curve across bars 1-100
Bar 101: REDRAWS curve across bars 2-101 ← ALL previous values change!
NON-REPAINTING PRMA:
Bar 100: Computes endpoint of regression on bars 1-100 → single fixed value
Bar 101: Computes endpoint of regression on bars 2-101 → new single fixed value
Bar 100's value NEVER changes ✅
8. USE CASES
8.1 Trend Following
Goal: Identify and ride medium-to-long-term trends
Setup:
text
Period: 150–200
Degree: 1.5–2.5
Smoothing: EMA, Length 10, Iterations 2
Strategy:
Go Long when PRMA turns green (rising) + price above PRMA
Go Short when PRMA turns fuchsia (falling) + price below PRMA
Exit on opposite signal or when price crosses PRMA against position
Example:
text
SELL signal
↓
Price: ──╱╲──╱╲──╱╲──╲╱──╲──╲╱──╲──
PRMA: ────────╱──────╲────────╲────
Color: ████████GREEN███FUCHSIA██████
↑ BUY signal
Markets: Stocks, ETFs, Forex (trending pairs like EUR/USD, USD/JPY)
Risk Management:
Stop loss: Below PRMA line (for longs) or recent swing low
Take profit: When opposite signal appears or fixed R:R ratio
Position sizing: Based on ATR distance from PRMA
8.2 Swing Trading
Goal: Capture medium-term price swings with clean entry/exit signals
Setup:
text
Period: 50–100
Degree: 3.0–4.0
Smoothing: HMA, Length 5, Iterations 1
Strategy:
Enter Long on "L" signal when price is above a higher-timeframe support
Enter Short on "S" signal when price is below a higher-timeframe resistance
Use PRMA direction color as bias filter
Example — Multi-Timeframe Approach:
text
Daily PRMA (Period 100, Degree 2): Rising → BULLISH BIAS
4H PRMA (Period 50, Degree 4): "L" signal appears
Action: Enter Long (aligned with daily bias)
Markets: Stocks, Crypto (BTC, ETH), Commodities
8.3 Scalping / Day Trading
Goal: Quick entries and exits on short timeframes
Setup:
text
Period: 20–50
Degree: 1.0–2.0
Smoothing: TEMA, Length 3, Iterations 1
Strategy:
Use on 1m–15m charts
Enter on signal in direction of PRMA slope
Exit quickly — target 1:1 or 1:1.5 R:R
Avoid signals during consolidation (flat PRMA)
Example — 5-Minute Chart:
text
09:30 ─────────╱── PRMA turns green
09:35 ── "L" signal, price > PRMA → BUY
09:50 ── Target hit, close position
10:15 ──╲──── PRMA turns fuchsia → flat/reverse
Markets: Futures (ES, NQ), Forex (major pairs), Crypto
8.4 Mean Reversion
Goal: Trade pullbacks to the PRMA line
Setup:
text
Period: 100–150
Degree: 2.0–3.0
Smoothing: Gaussian, Length 8, Iterations 2
Strategy:
Identify trend direction via PRMA color
Wait for price to pull back TO the PRMA line (touch or cross slightly)
Enter in the direction of the PRMA trend when price bounces off PRMA
Stop loss: Beyond the PRMA line
Example:
text
Uptrend (PRMA green):
Price: ──╱──╱──╲──╱──╱──╲──╱──
PRMA: ────╱────╱────╱────╱────
↑ ↑
Pullback Pullback
to PRMA to PRMA
= BUY = BUY
Markets: Stocks with strong trends, Index ETFs (SPY, QQQ)
8.5 Volatility Regime Detection
Goal: Determine if market is trending or ranging
Setup:
text
Period: 100
Degree: 4.0 (high responsiveness)
Smoothing: SMA, Length 15, Iterations 3 (ultra-smooth)
Strategy:
Flat PRMA (minimal direction changes) → Ranging market → Use mean reversion strategies
Clearly sloped PRMA (consistent color) → Trending market → Use trend following strategies
Frequent color changes → Choppy market → Reduce position size or stay out
Example:
text
Trending Phase: Choppy Phase: Ranging Phase:
PRMA: ────╱──╱── PRMA: ╱╲╱╲╱╲╱╲ PRMA: ──────────
Color: GREEN GREEN Color: G F G F G F Color: GREEN (flat)
Action: TREND FOLLOW Action: STAY OUT Action: MEAN REVERT
Markets: All — this is a meta-strategy for selecting other strategies
8.6 Multi-PRMA System
Goal: Use multiple PRMA instances for confluence-based trading
Setup (3 PRMA instances on same chart):
Instance Period Degree Smoothing Role
Fast PRMA 30 3.0 TEMA, 3, 1 Entry trigger
Medium PRMA 80 2.5 EMA, 5, 1 Trend filter
Slow PRMA 200 1.5 SMA, 10, 2 Major trend direction
Strategy:
text
STRONG BUY:
✅ Slow PRMA rising (major uptrend)
✅ Medium PRMA rising (confirmed trend)
✅ Fast PRMA gives "L" signal (entry timing)
✅ Price > all 3 PRMAs
STRONG SELL:
✅ Slow PRMA falling (major downtrend)
✅ Medium PRMA falling (confirmed trend)
✅ Fast PRMA gives "S" signal (entry timing)
✅ Price < all 3 PRMAs
AVOID:
❌ PRMAs disagree on direction
❌ Price between fast and slow PRMA
Markets: All — particularly effective on Daily charts for position trading
8.7 Crossover System with Other Indicators
Goal: Combine PRMA with traditional indicators for confirmation
PRMA + RSI:
text
Setup: PRMA (100, 3.0, EMA 5) + RSI(14)
Long Entry:
✅ PRMA "L" signal
✅ RSI > 50 (bullish momentum)
✅ RSI not overbought (< 70)
Short Entry:
✅ PRMA "S" signal
✅ RSI < 50 (bearish momentum)
✅ RSI not oversold (> 30)
PRMA + MACD:
text
Setup: PRMA (80, 2.5, HMA 5) + MACD(12,26,9)
Long: PRMA "L" + MACD histogram positive + MACD above signal line
Short: PRMA "S" + MACD histogram negative + MACD below signal line
PRMA + Volume:
text
Setup: PRMA (100, 3.0, VWMA 5) — already volume-aware via VWMA smoothing
Long: "L" signal + Volume > 1.5× average volume = HIGH CONVICTION
Long: "L" signal + Volume < average = LOW CONVICTION (smaller position)
8.8 Crypto-Specific Use Case
Goal: Navigate volatile crypto markets with adaptive smoothing
Setup:
text
Chart: 4H BTC/USDT
Period: 60
Degree: 3.5
Smoothing: Gaussian, Length 8, Iterations 2
Strategy:
Crypto moves fast → higher degree (3.5) catches reversals quickly
Crypto is noisy → Gaussian smoothing + 2 iterations removes whipsaws
Only trade signals aligned with Daily PRMA direction
Use wider stops (crypto volatility is 3-5× traditional markets)
Example — BTC Bull Run:
text
$40,000 ──────╱── PRMA green, "L" signal → ENTER LONG
$45,000 ──╱───── PRMA still green → HOLD
$48,000 ──╲───── PRMA turns fuchsia, "S" signal → EXIT
$44,000 ──╲───── PRMA still fuchsia → SHORT or FLAT
$42,000 ──╱───── PRMA green, "L" → ENTER LONG again
8.9 Portfolio / Asset Allocation
Goal: Use PRMA as a filter for risk-on/risk-off decisions
Setup:
text
Asset: SPY (S&P 500 ETF)
Period: 200
Degree: 1.5
Smoothing: RMA, Length 20, Iterations 3
Strategy:
text
Weekly PRMA Rising (Green):
→ 100% Equities allocation
→ Overweight growth stocks
→ Risk-on positioning
Weekly PRMA Falling (Fuchsia):
→ Reduce to 50% Equities
→ Increase bonds / cash
→ Risk-off positioning
Weekly PRMA Flat / Choppy:
→ 70% Equities
→ Diversified allocation
→ Neutral positioning
8.10 Adaptive Degree Selection Guide
Goal: Choose the right degree for current market conditions
text
Market Condition → Recommended Degree
─────────────────────────────────────────────
Strong linear trend → 1.0 - 1.5
Gradual curve/acceleration→ 2.0 - 2.5
Trend with pullbacks → 3.0 - 3.5
Complex / oscillating → 4.0 - 5.0
Very choppy → 1.0 (with heavy smoothing)
9. PARAMETER OPTIMIZATION TABLE
Trading Style Timeframe Period Degree Smooth Method Smooth Length Iterations
Scalping 1m–5m 20–30 1.0–2.0 TEMA 3 1
Day Trading 5m–15m 30–60 2.0–3.0 HMA 5 1
Swing Trading 1H–4H 50–100 3.0–4.0 EMA 5–8 1–2
Position Trading Daily 100–200 2.0–3.0 Gaussian 8–12 2
Investing Weekly 50–100 1.0–2.0 RMA 10–20 2–3
Crypto Trading 4H 50–80 3.0–4.0 Gaussian 8 2
Forex 1H 60–120 2.0–3.0 DEMA 5 1
Futures 5m–30m 30–60 2.0–3.0 HMA 5 1
Low Noise Any Any 1.5–2.5 SMA 15–20 3–4
Fast Response Any 20–50 4.0–5.0 None – –
10. DEGREE COMPARISON VISUAL
text
Degree 1.0 (Linear):
Price: ╱╲╱──╱╲──╱╲╱╲──╱╲
PRMA: ────────╱────────── Very smooth, slow to turn
Signals: ▲ Rare signals
Degree 2.0 (Quadratic):
Price: ╱╲╱──╱╲──╱╲╱╲──╱╲
PRMA: ──────╱──────╲──── Moderate curvature
Signals: ▲ ▼ Balanced signals
Degree 3.0 (Cubic):
Price: ╱╲╱──╱╲──╱╲╱╲──╱╲
PRMA: ────╱──╱──╲──╲╱─── Catches inflections
Signals: ▲ ▲ ▼ ▲ More signals
Degree 4.0 (Quartic):
Price: ╱╲╱──╱╲──╱╲╱╲──╱╲
PRMA: ──╱╲─╱╲──╲╱╲─╱╲── Very responsive
Signals: ▲▼ ▲▼ ▼▲▼ ▲▼ Many signals (may whipsaw)
Degree 4.0 + Smoothing (EMA 5, Iter 2):
Price: ╱╲╱──╱╲──╱╲╱╲──╱╲
PRMA: ───╱───╱───╲───╲── Responsive but clean
Signals: ▲ ▲ ▼ ▼ Filtered, reliable signals ✅
11. SMOOTHING ITERATIONS VISUAL
text
Raw PRMA (No Smoothing):
╱╲╱╲╱──╱╲──╲╱╲╱╲──╱╲ Noisy, many direction changes
1 Iteration (EMA 5):
─╱╲╱───╱╲───╲╱╲───╱─ Some noise removed
2 Iterations (EMA 5):
──╱─────╱─────╲────╱─ Much cleaner
3 Iterations (EMA 5):
───╱─────╱──────╲───╱ Very smooth, clear trend
5 Iterations (EMA 5):
────╱──────╱───────╲─ Ultra-smooth, trend only
12. STRENGTHS & LIMITATIONS
✅ Strengths
Feature Benefit
Non-repainting Reliable for backtesting and live trading — what you see is what you get
Fractional degree Unprecedented fine-tuning between integer polynomial degrees
10 smoothing methods Adapt to any market condition or trading style
Multi-iteration smoothing Cascaded filtering for noise-free output
Precomputed kernel Computationally efficient — fixed weights, simple weighted sum
Generalizes LSMA Degree 1 = LSMA; higher degrees capture curves
Confirmed signals Price must be on the correct side of PRMA for signal validation
Visual clarity Color-coded direction makes trend identification instant
⚠️ Limitations
Limitation Mitigation
Lag (inherent in all MAs) Use lower period, higher degree, or TEMA/HMA smoothing
Overfitting (high degree + short period) Keep degree ≤ period/20 as rule of thumb
Whipsaws in ranging markets Increase smoothing iterations or add trend filter
No prediction — shows current state, not forecast Combine with leading indicators (RSI, MACD)
Runge's phenomenon at extreme degrees Stay below degree 8–10 for practical use
Fixed lag offset of length bars This ensures non-repainting — a deliberate trade-off
Over-smoothing possible with high iterations Start with 1–2 iterations, increase only if needed
13. QUICK-START RECOMMENDATIONS
Beginner Setup (Start Here)
text
Period: 100 | Degree: 2.0 | Smooth: EMA | Length: 5 | Iterations: 1
→ Clean, balanced, works on most markets and timeframes
Intermediate Setup
text
Period: 80 | Degree: 3.0 | Smooth: HMA | Length: 5 | Iterations: 1
→ More responsive to curves, low-lag smoothing
Advanced Setup
text
Period: 60 | Degree: 3.5 | Smooth: Gaussian | Length: 8 | Iterations: 2
→ Captures complex patterns with natural noise reduction
14. SUMMARY
PRMA bridges the gap between simple moving averages and complex curve-fitting analysis. It transforms polynomial regression from a repainting analytical overlay into a practical, non-repainting trading tool with:
Fractional polynomial degrees for precision tuning
9 smoothing methods + multi-iteration for adaptive noise reduction
Clean directional signals validated by price confirmation
Zero repainting guaranteed by fixed kernel architecture
Whether you're scalping crypto on a 1-minute chart or managing a portfolio on weekly timeframes, PRMA's configurable parameters can be optimized for your specific trading style and market conditions. インジケーター

Market Gravity: Relative Value Engine---
**Relative Value Model (Enhanced)**
This indicator calculates a statistically-derived fair value for your asset by modeling its historical relationship with a reference symbol (default: USDT Dominance). It supports three model types — Linear Range, Linear Regression, and Logarithmic Range — and outputs a prediction line, residual bands, Z-Score signals, and a full metrics dashboard.
---
**What Does This Indicator Do?**
This indicator builds a statistical price model output by comparing your current chart's price to a reference symbol. It calculates what your asset's price *should* be based on the historical relationship between the two symbols, then measures how far the actual price deviates from that prediction. In short: it answers the question — *"Is this asset overvalued or undervalued relative to a correlated market driver?"*
---
**How the Three Models Work**
**Linear Range**
Maps the reference symbol's high/low range to the current chart's high/low range using a simple slope/intercept formula. Best for assets that move in proportion to the reference linearly.
**Linear Regression (Correlation)** *(Default)*
Uses Pearson correlation, standard deviation, and rolling means to calculate a beta (slope) and alpha (intercept) — essentially a rolling OLS regression. This is the most statistically rigorous method and handles non-proportional relationships better.
**Logarithmic Range**
Performs the same range mapping as Linear Range but in log space, then exponentiates back. Ideal for assets with exponential price behavior (e.g., crypto over long timeframes).
---
**Dashboard Panel — What Each Row Means**
**Regime** — Whether price is above (Premium) or below (Discount) the model. Green = overpriced vs model; Red = underpriced.
**Diff %** — Percentage deviation of actual price from predicted price. +5% means price is 5% above the model estimate.
**Prediction** — The model's estimated fair price for the current bar. Your fair value anchor.
**Z-Score** — How many standard deviations price is from the prediction. Above +2 or below -2 is considered statistically extreme.
**Z-Score State** — Normal or Extreme based on your threshold setting. Extreme signals a potential mean-reversion setup.
**R²** — R-squared, goodness of fit from 0 to 1. ≥0.6 = Strong, 0.35–0.6 = Moderate, below 0.35 = Weak. Only trust the model when quality is at least Moderate.
**Model Quality** — Text label derived from R². Use signals only when this reads Moderate or Strong.
**MAE** — Mean Absolute Error in price units. Lower = model tracks price more closely.
**MAPE %** — Mean Absolute Percentage Error. Lower percentage = more accurate model overall.
**Smoothing** — Shows the active moving average type and length applied to the prediction line.
---
**Visual Elements on the Chart**
- Yellow line — The predicted fair-value price line
- Aqua bands — Upper and lower residual bands (predicted ± multiplier × standard deviation). Price outside these bands is statistically stretched.
- Green fill — Premium zone, price is above the model
- Red fill — Discount zone, price is below the model
- LONG label — Price crossed above the prediction line, bullish regime shift
- SHORT label — Price crossed below the prediction line, bearish regime shift
- Z+ triangle — Z-Score crossed above the extreme threshold, potential reversal warning
- Z- triangle — Z-Score crossed below the negative threshold, potential reversal warning
---
**Settings Guide**
*Data and Model*
- Reference Symbol: Default is USDT Dominance. Try DXY, SPX, BTC, or any asset correlated to your chart.
- Reference Timeframe: Leave blank to match your chart, or set a higher timeframe for macro-level signals.
- Model Type: Start with Linear Regression. Switch to Logarithmic Range for crypto on long-term charts.
- Lookback Period: Use 10–20 on lower timeframes (1H, 4H), and 50–100 on daily or weekly charts.
*Smoothing*
- Smoothing Type: EMA reacts faster, RMA is smoother, None gives the raw model output.
- Smoothing Length: Increase to reduce noise, decrease for more responsiveness.
*Signals and Risk*
- Residual Band Multiplier: Default 1.5. Try 1.0–2.5. Higher = wider bands, fewer signals.
- Z-Score Threshold: Default 2.0. Use 1.5 for more frequent signals, 2.5 for rarer and stronger ones.
*Visualization*
- All colors, band visibility, and panel on/off are fully customizable. Auto theme detects your chart background automatically.
---
**Built-in Alerts**
Three alert conditions are included:
1. Z-Score Premium Threshold Crossed — price enters extreme overvalued territory above the model.
2. Z-Score Discount Threshold Crossed — price enters extreme undervalued territory below the model.
3. Price Crossed Model — price crosses the prediction line in either direction, possible regime change.
To activate, go to Alerts → Create Alert → Condition → select this indicator.
---
*This indicator is for educational and analytical purposes only. Not financial advice.* インジケーター

LSMA SD | GForgeLSMA SD | GForge
LSMA SD is a trend-following oscillator built for swing trading on higher timeframes. It generates rules-based long and exit signals by measuring where price sits within a statistically-defined volatility envelope anchored to a regression-based trend line.
Core Calculation
The basis line is a Least Squares Moving Average. Unlike a standard moving average which weights past prices, LSMA computes the mathematically optimal straight-line fit across a defined lookback window. This means the basis reflects the actual gradient of a trend — its slope tells you the rate and direction of price movement, not a smoothed echo of where price has been. A short EMA pass is applied to the raw LSMA output as a robustness measure, absorbing single-bar snap artifacts that occur when outlier candles enter or exit the regression window. This is not a smoothing aesthetic — it directly addresses a known fragility in raw LinReg endpoints.
The default source is hlc3 — the average of high, low, and close — rather than close alone. This distributes the regression input across the full bar range, reducing sensitivity to end-of-session price mechanics such as stop runs and last-minute order flow that can distort the trend line without reflecting genuine directional movement.
A Standard Deviation envelope is then constructed around the LSMA basis at a fixed multiplier. The band width is driven entirely by actual price volatility — it widens during high-volatility periods and tightens during quiet ones. There is no secondary adaptive scaling layer. This is intentional: additional dynamic scaling introduces a second noisy signal on top of the basis movement, which in practice degrades signal quality.
The Oscillator
The oscillator expresses where price currently sits within the SD bands on a 0–100 scale. A reading of 0 means price is at the lower band. A reading of 100 means price is at the upper band. A reading of 50 means price is sitting directly on the LSMA trend line itself — the neutral zone between the two signal thresholds represents price consolidating around the regression basis.
Long signals fire when the oscillator crosses above the long threshold (default 74), meaning price has broken decisively into the upper band zone — a momentum confirmation in the direction of the trend, not a mean-reversion trigger. Exit and short signals fire when the oscillator crosses below the short threshold (default 33).
This is a trend-continuation system, not a reversal indicator.
Parameters
The indicator is intentionally low-parameter. LSMA Length sets the regression window. StdDev Length sets the band width lookback and can differ from the LSMA length. StdDev Multiplier sets the fixed band scale. Endpoint Smoothing controls how aggressively window-edge artifacts are absorbed — setting it to 1 disables it entirely. Fewer parameters means less surface area for curve-fitting to historical data.
Default settings are optimised for BTC on the 1D timeframe. Optimize thresholds and lengths for different assets and timeframes before use.
Risk Warning
This indicator is provided for informational and educational purposes only. Past performance, including any results visible on historical bars, does not guarantee or imply future returns. All trading involves risk. You should not make trading decisions based solely on any single indicator. Always apply independent analysis and appropriate risk management.
Developed by GForge インジケーター

インジケーター

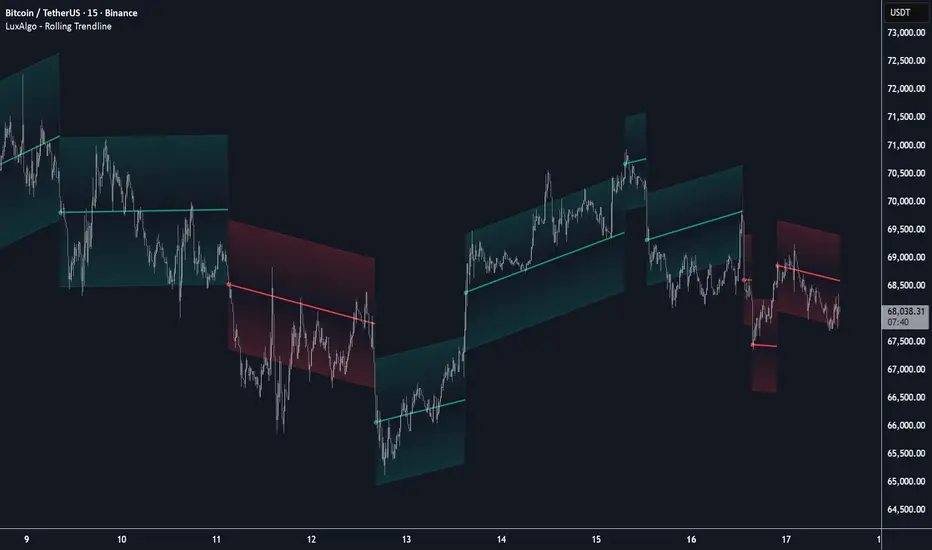
Rolling Trendline [LuxAlgo]The Rolling Trendline indicator provides a dynamic, self-adjusting trendline that tracks price action using linear regression slope projections and automatically resets when price deviates beyond a specific threshold.
🔶 USAGE
The indicator is designed to provide a continuous trend bias without the "lag" often associated with static linear regression lines. It projects a line forward based on a calculated slope and only shifts its trajectory when the market demonstrates a significant change in momentum.
The addition of ATR-based volatility zones allows traders to visualize a range of expected price action around the projected trend, providing a buffer that accounts for market volatility at the time of each trend reset.
🔹 Interpreting the Line and Zones
Bullish Phase (Green): Indicates an upward-sloping trajectory. The trendline and its surrounding ATR zones will be colored green, suggesting a bullish bias.
Bearish Phase (Red): Indicates a downward-sloping trajectory. The trendline and its surrounding ATR zones will be colored red, suggesting a bearish bias.
ATR Zones: These shaded areas represent a volatility-adjusted range. As long as price remains within the deviation threshold, the zones follow the trendline's trajectory.
Reset Points: Visualized by a small circle and a break in the line, these occur when price moves too far from the projection. At this moment, the indicator re-anchors to the current price and recalculates both the slope and the ATR zone width.
🔶 DETAILS
The indicator follows a specific logic flow to maintain its "Rolling" characteristic:
1. Slope Calculation: It calculates the Linear Regression slope over a user-defined lookback period. This slope represents the average rate of change in price.
2. Projection: On every new bar, the indicator projects the next value of the trendline by adding the active slope to the previous trendline value.
3. Deviation Check: The indicator calculates a Standard Deviation threshold. If the distance between the current price and the projected trendline value exceeds this threshold, a reset is triggered.
4. Re-Anchoring: Upon a reset, the trendline "rolls" to the current price and adopts the most recent linear regression slope. Simultaneously, it captures the current ATR to set the width of the new trend zones.
🔶 SETTINGS
🔹 Trend Settings
Slope Lookback: The period used to calculate the linear regression slope. Higher values result in a slope that considers more historical data.
Deviation Multiplier: Determines how far price can deviate from the trendline before a reset occurs.
Slope Divisor: This setting allows you to tame the trajectory of the line. Higher values divide the captured slope, resulting in flatter trendlines.
Source: The price data used for all calculations (default is Close).
🔹 ATR Zones
ATR Length: The lookback period used for the Average True Range calculation, which determines the width of the volatility bands.
ATR Multiplier: Controls the width of the shaded zones around the trendline.
🔹 Visuals
Bullish/Bearish Trend Colors: Customizes the colors for the trendline and zones based on the slope direction.
Zone Color: Sets the base color for the ATR area fills.
Line Width: Adjusts the thickness of the primary rolling trendline.
インジケーター

Volume Weighted Intra Bar LR KurtosisThis indicator analyzes market character by decomposing total
Excess Kurtosis ("Fat Tails") of a SINGLE BAR into four distinct,
interpretable components based on a Linear Regression model.
Key Features:
1. **Intra-Bar LR Kurtosis Decomposition:** For each bar on the chart,
the indicator analyzes the underlying price action on a smaller
timeframe ('Intra-Bar Timeframe'). It fits a Linear Regression
line through the intra-bar data to decompose the 4th Moment:
- **Trend Kurtosis (Gold):** Peakedness of the regression line
itself. High values indicate the price path within the bar
moves in sudden jumps, steps, or gaps (discontinuous path).
- **Residual Kurtosis (Red):** Excess Kurtosis of the noise
around the regression line. Captures "Hidden Tail Risk" or
extreme outliers within the bar relative to the trend.
- **Within-Bar Kurtosis (Blue):** Fat tails derived from the
microstructure of individual intra-bar candles.
- **Interaction Variance (Dark Grey):** The comovement of variance
and mean deviations (volatility clustering relative to trend).
- **Interaction Skewness (Darker Grey):** The comovement of skewness
and mean deviations (asymmetry relative to trend).
2. **Visual Decomposition Logic:** Total Excess Kurtosis is the
primary metric displayed. Since statistical moments are additive,
this indicator calculates the *exact* Total Kurtosis and partitions
the columns based on the Law of Total Moments.
3. **Dual Display Modes:** The indicator offers two modes to
visualize this decomposition:
- **Absolute Mode:** Plots the *total* kurtosis as a
stacked column chart. Stacking logic groups components to
ensure visual clarity of the magnitude.
- **Relative Mode:** Plots the direct *contribution ratio*
(proportion) of each component relative to the total sum,
ideal for identifying the dominant driver (Trend vs. Noise).
4. **Calculation Options:**
- **Normalization:** An optional 'Normalize' setting
transforms inputs into logarithmic space, analyzing the
kurtosis of *returns* rather than absolute prices.
- **Volume Weighting:** An option (`Volume weighted`) applies
volume weighting to all regression and moment calculations,
emphasizing high-participation moves.
5. **Kurtosis Cycle Analysis:**
- **Pivot Detection:** Includes a built-in pivot detector
that identifies significant turning points (peaks/valleys) in
the *total* kurtosis line. (Note: This is only visible
in 'Absolute Mode').
- **Flexible Pivot Algorithms:** Supports various underlying
mathematical models for pivot detection provided by the
core library.
6. **Note on Confirmation (Lag):** Pivot signals are confirmed
using a lookback method. A pivot is only plotted *after*
the `Pivot Right Bars` input has passed, which introduces
an inherent lag.
7. **Multi-Timeframe (MTF) Capability:**
- **MTF Analysis Lines:** The entire intra-bar analysis can be
run on a higher timeframe (using the `Timeframe` input),
with standard options to handle gaps (`Fill Gaps`) and
prevent repainting (`Wait for...`).
- **Limitation:** The Pivot detection (`Calculate Pivots`) is
**disabled** if a Higher Timeframe (HTF) is selected.
8. **Integrated Alerts:** Includes comprehensive alerts for:
- Kurtosis magnitude (High Positive / High Negative).
- Character changes (Trend Jumps vs. Noise Outliers).
- Total Kurtosis pivot (High/Low) detection.
**Caution: Real-Time Data Behavior (Intra-Bar Repainting)**
This indicator uses high-resolution intra-bar data. As a result, the
values on the **current, unclosed bar** (the real-time bar) will
update dynamically as new intra-bar data arrives. This behavior is
normal and necessary for this type of analysis. Signals should only
be considered final **after the main chart bar has closed.**
---
**DISCLAIMER**
1. **For Informational/Educational Use Only:** This indicator is
provided for informational and educational purposes only. It does
not constitute financial, investment, or trading advice, nor is
it a recommendation to buy or sell any asset.
2. **Use at Your Own Risk:** All trading decisions you make based on
the information or signals generated by this indicator are made
solely at your own risk.
3. **No Guarantee of Performance:** Past performance is not an
indicator of future results. The author makes no guarantee
regarding the accuracy of the signals or future profitability.
4. **No Liability:** The author shall not be held liable for any
financial losses or damages incurred directly or indirectly from
the use of this indicator.
5. **Signals Are Not Recommendations:** The alerts and visual signals
(e.g., crossovers) generated by this tool are not direct
recommendations to buy or sell. They are technical observations
for your own analysis and consideration. インジケーター

Volume Weighted LR KurtosisThis indicator analyzes market character by decomposing total
Excess Kurtosis ("Fat Tails") into four distinct, interpretable
components based on a Linear Regression model.
Key Features:
1. **Four-Component Kurtosis Decomposition:** The indicator
separates market tail risk based on the 'Estimate Bar Statistics' option.
It leverages the Law of Total Moments to provide an additive
breakdown of the 4th Statistical Moment:
- **Trend Kurtosis (Gold):** Peakedness of the regression line
itself. High values indicate the trend moves in sudden jumps,
steps, or gaps (discontinuous path).
- **Residual Kurtosis (Red):** Excess Kurtosis of the noise
around the regression line. This captures the "Hidden Tail Risk"
(extreme outliers relative to the trend).
- **Within-Bar Kurtosis (Blue):** Fat tails derived from the
microstructure of individual bars (requires 'Estimate Bar Statistics').
- **Interaction Variance (Dark Grey):** The comovement of variance
and mean deviations (volatility clustering relative to trend).
- **Interaction Skewness (Darker Grey):** The comovement of skewness
and mean deviations (asymmetry relative to trend).
2. **Visual Decomposition Logic:** Total Excess Kurtosis is the
primary metric displayed. Since statistical moments are additive,
this indicator calculates the *exact* Total Kurtosis and partitions
the area to visualize the contribution (weight) of each
structural source to the overall tail risk.
3. **Dual Display Modes:** The indicator offers two modes to
visualize this decomposition:
- **Absolute Mode:** Displays the *total* kurtosis as a
stacked area chart, allowing to see the magnitude of tail risk.
Stacking logic groups components to ensure visual clarity.
- **Relative Mode:** Displays the direct *contribution ratio*
(proportion) of each component relative to the total sum,
ideal for identifying the dominant driver of the risk.
4. **Calculation Options:**
- **Normalization:** An optional 'Normalize' setting
transforms inputs into logarithmic space, analyzing the
kurtosis of *returns* rather than absolute prices.
- **Volume Weighting:** An option (`Volume weighted`) applies
volume weighting to all regression and moment calculations,
emphasizing high-participation moves.
5. **Kurtosis Cycle Analysis:**
- **Pivot Detection:** Includes a built-in pivot detector
that identifies significant turning points (peaks/valleys) in
the *total* kurtosis line. This helps identify extremes in
market fragility or structural changes.
- **Flexible Pivot Algorithms:** Supports various underlying
mathematical models for pivot detection provided by the
core library.
6. **Note on Confirmation (Lag):** Pivot signals are confirmed
using a lookback method. A pivot is only plotted *after*
the `Pivot Right Bars` input has passed, which introduces
an inherent lag.
7. **Multi-Timeframe (MTF) Capability:**
- **MTF Kurtosis Lines:** The kurtosis lines can be
calculated on a higher timeframe, with standard options
to handle gaps (`Fill Gaps`) and prevent repainting
(`Wait for...`).
- **Limitation:** The Pivot detection (`Calculate Pivots`) is
**disabled** if a Higher Timeframe (HTF) is selected.
8. **Integrated Alerts:** Includes comprehensive alerts for:
- Kurtosis magnitude (High Positive / High Negative).
- Kurtosis character changes/emerging/fading.
- Total Kurtosis pivot (High/Low) detection.
---
**DISCLAIMER**
1. **For Informational/Educational Use Only:** This indicator is
provided for informational and educational purposes only. It does
not constitute financial, investment, or trading advice, nor is
it a recommendation to buy or sell any asset.
2. **Use at Your Own Risk:** All trading decisions you make based on
the information or signals generated by this indicator are made
solely at your own risk.
3. **No Guarantee of Performance:** Past performance is not an
indicator of future results. The author makes no guarantee
regarding the accuracy of the signals or future profitability.
4. **No Liability:** The author shall not be held liable for any
financial losses or damages incurred directly or indirectly from
the use of this indicator.
5. **Signals Are Not Recommendations:** The alerts and visual signals
(e.g., crossovers) generated by this tool are not direct
recommendations to buy or sell. They are technical observations
for your own analysis and consideration. インジケーター

Volume Weighted Intra Bar LR SkewnessThis indicator analyzes market character by decomposing total
skewness (asymmetry) of a SINGLE BAR into four distinct,
interpretable components based on a Linear Regression model.
Key Features:
1. **Intra-Bar LR Skewness Decomposition:** For each bar on the chart,
the indicator analyzes the underlying price action on a smaller
timeframe ('Intra-Bar Timeframe'). It fits a Linear Regression
line through the intra-bar data to decompose the 3rd Moment:
- **Trend Skewness (Green/Red):** Asymmetry originating from
the slope of the intra-bar regression line. Indicates if the
price path within the bar is geometrically trend-driven.
- **Residual Skewness (Yellow):** Asymmetry of the noise
around the regression line. Captures "Tail Risk" or sudden
shocks within the bar that deviate from the main path.
- **Within-Bar Skewness (Blue):** Asymmetry derived from the
microstructure of individual intra-bar candles.
- **Interaction Skewness (Dark Grey):** Asymmetry caused by
the correlation between price levels and volatility within
the bar (e.g., volatility expanding as price drops).
2. **Visual Decomposition Logic:** Total Skewness is the
primary metric displayed. Since statistical moments are additive,
this indicator calculates the *exact* Total Skewness and partitions
the columns based on the Law of Total Moments.
3. **Dual Display Modes:** The indicator offers two modes to
visualize this decomposition:
- **Absolute Mode:** Plots the *total* skewness as a
stacked column chart. Stacking logic groups components with
the same sign to ensure visual clarity.
- **Relative Mode:** Plots the direct *contribution ratio*
(proportion) of each component relative to the total sum,
ideal for identifying the dominant driver (Trend vs. Noise).
4. **Calculation Options:**
- **Normalization:** An optional 'Normalize' setting
transforms inputs into logarithmic space, analyzing the
skewness of *returns* rather than absolute prices.
- **Volume Weighting:** An option (`Volume weighted`) applies
volume weighting to all regression and moment calculations,
emphasizing high-participation moves.
5. **Skewness Cycle Analysis:**
- **Pivot Detection:** Includes a built-in pivot detector
that identifies significant turning points (peaks/valleys) in
the *total* skewness line. (Note: This is only visible
in 'Absolute Mode').
- **Flexible Pivot Algorithms:** Supports various underlying
mathematical models for pivot detection provided by the
core library.
6. **Note on Confirmation (Lag):** Pivot signals are confirmed
using a lookback method. A pivot is only plotted *after*
the `Pivot Right Bars` input has passed, which introduces
an inherent lag.
7. **Multi-Timeframe (MTF) Capability:**
- **MTF Analysis Lines:** The entire intra-bar analysis can be
run on a higher timeframe (using the `Timeframe` input),
with standard options to handle gaps (`Fill Gaps`) and
prevent repainting (`Wait for...`).
- **Limitation:** The Pivot detection (`Calculate Pivots`) is
**disabled** if a Higher Timeframe (HTF) is selected.
8. **Integrated Alerts:** Includes comprehensive alerts for:
- Skewness magnitude (High Positive / High Negative).
- Character changes (Trend vs. Noise dominance).
- Total Skewness pivot (High/Low) detection.
**Caution: Real-Time Data Behavior (Intra-Bar Repainting)**
This indicator uses high-resolution intra-bar data. As a result, the
values on the **current, unclosed bar** (the real-time bar) will
update dynamically as new intra-bar data arrives. This behavior is
normal and necessary for this type of analysis. Signals should only
be considered final **after the main chart bar has closed.**
---
**DISCLAIMER**
1. **For Informational/Educational Use Only:** This indicator is
provided for informational and educational purposes only. It does
not constitute financial, investment, or trading advice, nor is
it a recommendation to buy or sell any asset.
2. **Use at Your Own Risk:** All trading decisions you make based on
the information or signals generated by this indicator are made
solely at your own risk.
3. **No Guarantee of Performance:** Past performance is not an
indicator of future results. The author makes no guarantee
regarding the accuracy of the signals or future profitability.
4. **No Liability:** The author shall not be held liable for any
financial losses or damages incurred directly or indirectly from
the use of this indicator.
5. **Signals Are Not Recommendations:** The alerts and visual signals
(e.g., crossovers) generated by this tool are not direct
recommendations to buy or sell. They are technical observations
for your own analysis and consideration. インジケーター

Volume Weighted LR SkewnessThis indicator analyzes market character by decomposing total
skewness (asymmetry) into four distinct, interpretable components
based on a Linear Regression model.
Key Features:
1. **Four-Component Skewness Decomposition:** The indicator
separates market asymmetry based on the 'Estimate Bar Statistics' option.
It leverages the Law of Total Moments to provide an additive
breakdown of the 3rd Statistical Moment:
- **Trend Skewness (Green/Red):** Asymmetry originating from
the slope of the regression line itself. Indicates if the
trend path is geometrically skewed.
- **Residual Skewness (Yellow):** Asymmetry of the noise
around the regression line. Captures "Tail Risk" (e.g.,
sudden spikes against the trend).
- **Within-Bar Skewness (Blue):** Asymmetry derived from the
microstructure of individual bars (requires 'Estimate Bar Statistics').
- **Interaction Skewness (Dark Grey):** Asymmetry caused by the
correlation between price levels and volatility (e.g.,
volatility expanding as price moves in one direction).
*Dominance of this component indicates an unstable, emotional market.*
2. **Visual Decomposition Logic:** Total Skewness is the
primary metric displayed. Since statistical moments are additive,
this indicator calculates the *exact* Total Skewness and partitions
the area to visualize the contribution (weight) of each
structural source to the overall market bias.
3. **Dual Display Modes:** The indicator offers two modes to
visualize this decomposition:
- **Absolute Mode:** Displays the *total* skewness as a
stacked area chart, allowing to see the magnitude of tail risk.
Stacking logic groups components with the same sign to ensure
visual clarity.
- **Relative Mode:** Displays the direct *contribution ratio*
(proportion) of each component relative to the total sum,
ideal for identifying the dominant driver of asymmetry.
4. **Calculation Options:**
- **Normalization:** An optional 'Normalize' setting
transforms inputs into logarithmic space, analyzing the
skewness of *returns* rather than absolute prices.
- **Volume Weighting:** An option (`Volume weighted`) applies
volume weighting to all regression and moment calculations,
emphasizing high-participation moves.
5. **Skewness Cycle Analysis:**
- **Pivot Detection:** Includes a built-in pivot detector
that identifies significant turning points (peaks/valleys) in
the *total* skewness line. This helps identify extremes in
market sentiment or structural bias.
- **Flexible Pivot Algorithms:** Supports various underlying
mathematical models for pivot detection provided by the
core library.
6. **Note on Confirmation (Lag):** Pivot signals are confirmed
using a lookback method. A pivot is only plotted *after*
the `Pivot Right Bars` input has passed, which introduces
an inherent lag.
7. **Multi-Timeframe (MTF) Capability:**
- **MTF Skewness Lines:** The skewness lines can be
calculated on a higher timeframe, with standard options
to handle gaps (`Fill Gaps`) and prevent repainting
(`Wait for...`).
- **Limitation:** The Pivot detection (`Calculate Pivots`) is
**disabled** if a Higher Timeframe (HTF) is selected.
8. **Integrated Alerts:** Includes comprehensive alerts for:
- Skewness magnitude (High Positive / High Negative).
- Skewness character changes/emerging/fading.
- Total Skewness pivot (High/Low) detection.
---
**DISCLAIMER**
1. **For Informational/Educational Use Only:** This indicator is
provided for informational and educational purposes only. It does
not constitute financial, investment, or trading advice, nor is
it a recommendation to buy or sell any asset.
2. **Use at Your Own Risk:** All trading decisions you make based on
the information or signals generated by this indicator are made
solely at your own risk.
3. **No Guarantee of Performance:** Past performance is not an
indicator of future results. The author makes no guarantee
regarding the accuracy of the signals or future profitability.
4. **No Liability:** The author shall not be held liable for any
financial losses or damages incurred directly or indirectly from
the use of this indicator.
5. **Signals Are Not Recommendations:** The alerts and visual signals
(e.g., crossovers) generated by this tool are not direct
recommendations to buy or sell. They are technical observations
for your own analysis and consideration. インジケーター

Volume Weighted Intra Bar LR CorrelationThis indicator analyzes market character by providing a detailed
view of correlation. It applies a Linear Regression model to
intra-bar price action, dissecting the total correlation of
each bar into three distinct components.
Key Features:
1. **Three-Component Correlation Decomposition:** The indicator
separates correlation based on the 'Estimate Bar Statistics' option.
- **Standard Mode (`Estimate Bar Statistics` = OFF):** Calculates
correlation based on the selected `Source` (this results
mainly in 'Trend' and 'Residual' correlation).
- **Decomposition Mode (`Estimate Bar Statistics` = ON):** The
indicator uses a statistical model ('Estimator') to
calculate *within-bar* correlation.
(Assumption: In this mode, the `Source` input is
**ignored**, and an estimated mean for each bar is used
instead).
This separates correlation into:
- **Trend Correlation (Green/Red):** Correlation explained by the
regression's slope (Directional Alignment).
- **Residual Correlation (Yellow):** Correlation from price
oscillating around the regression line (Mean-Reversion/Cointegration).
- **Within-Bar Correlation (Blue):** Correlation from the
high-low range of each bar (Microstructure/Noise).
2. **Visual Decomposition Logic:** Total Correlation is the
primary metric displayed. Since Correlation Coefficients are not
linearly additive, this indicator plots the *exact* Total
Correlation and partitions the area underneath based on the
Covariance Ratio. This ensures the displayed total correlation
remains mathematically accurate while showing relative composition.
3. **Dual Display Modes:** The indicator offers two modes to
visualize this decomposition:
- **Absolute Mode:** Displays the *total* correlation as a
stacked area chart, partitioned by the ratio of
the three components.
- **Relative Mode:** Displays the direct *energy ratio*
(proportion) of each component relative to the total (0-1),
ideal for identifying the dominant market character.
4. **Calculation Options:**
- **Normalization:** An optional 'Normalize' setting
calculates an **Exponential Regression Curve** (log-space),
making the analysis suitable for growth assets.
- **Volume Weighting:** An option (`Volume weighted`) applies
volume weighting to all regression and correlation calculations.
5. **Correlation Cycle Analysis:**
- **Pivot Detection:** Includes a built-in pivot detector
that identifies significant turning points (highs and lows) in
the *total* correlation line. (Note: This is only visible
in 'Absolute Mode').
- **Flexible Pivot Algorithms:** Supports various underlying
mathematical models for pivot detection provided by the
core library.
6. **Note on Confirmation (Lag):** Pivot signals are confirmed
using a lookback method. A pivot is only plotted *after*
the `Pivot Right Bars` input has passed, which introduces
an inherent lag.
7. **Multi-Timeframe (MTF) Capability:**
- **MTF Correlation Lines:** The correlation lines can be
calculated on a higher timeframe, with standard options
to handle gaps (`Fill Gaps`) and prevent repainting
(`Wait for...`).
- **Limitation:** The Pivot detection (`Calculate Pivots`) is
**disabled** if a Higher Timeframe (HTF) is selected.
8. **Integrated Alerts:** Includes comprehensive alerts for:
- Correlation magnitude (High Positive / High Inverse).
- Correlation character changes/emerging/fading.
- Total Correlation pivot (High/Low) detection.
**Caution! Real-Time Data Behavior (Intra-Bar Repainting)**
This indicator uses high-resolution intra-bar data. As a result, the
values on the **current, unclosed bar** (the real-time bar) will
update dynamically as new intra-bar data arrives. This behavior is
normal and necessary for this type of analysis. Signals should only
be considered final **after the main chart bar has closed.**
---
**DISCLAIMER**
1. **For Informational/Educational Use Only:** This indicator is
provided for informational and educational purposes only. It does
not constitute financial, investment, or trading advice, nor is
it a recommendation to buy or sell any asset.
2. **Use at Your Own Risk:** All trading decisions you make based on
the information or signals generated by this indicator are made
solely at your own risk.
3. **No Guarantee of Performance:** Past performance is not an
indicator of future results. The author makes no guarantee
regarding the accuracy of the signals or future profitability.
4. **No Liability:** The author shall not be held liable for any
financial losses or damages incurred directly or indirectly from
the use of this indicator.
5. **Signals Are Not Recommendations:** The alerts and visual signals
(e.g., crossovers) generated by this tool are not direct
recommendations to buy or sell. They are technical observations
for your own analysis and consideration. インジケーター

Volume Weighted LR Z ScoreThis indicator calculates the Volume Weighted Linear Regression
Z-Score (VWLRZS). Unlike a standard Z-Score which measures
deviation from a static mean, this oscillator measures the
statistical distance of price from a dynamic Volume-Weighted
Linear Regression Line (Analysis of Residuals).
Key Features:
1. **Volatility Decomposition:** The indicator separates volatility
based on the 'Estimate Bar Statistics' option.
- **Standard Mode (`Estimate Bar Statistics` = OFF):** Calculates
standard Regression Residuals using the selected `Source`
for both the regression line (baseline) and the signal.
- **Decomposition Mode (`Estimate Bar Statistics` = ON):**
Uses a hybrid statistical approach:
a) **The Model (Baseline):** Uses an estimator to calculate
the 'within-bar' mean and fits the Linear Regression
through these statistical centers. This creates a
stable, trend-following expectation model.
b) **The Signal (Observation):** Compares the actual `Source`
(e.g., Close) against this regression line.
(Result: A Z-Score that measures deviations from the current
trend slope rather than a flat average).
2. **Visual Decomposition Logic:** Total Standard Deviation (of
Residuals) is the primary metric displayed. Since Standard
Deviations are not linearly additive (sqrt(a+b) != sqrt(a)+sqrt(b)),
this indicator calculates the *exact* Total Z-Score and partitions
the area underneath based on the Variance Ratio. This ensures the
displayed total volatility remains mathematically accurate while
showing relative composition.
3. **Normalization (Exponential Regression):** Includes an optional
'Normalize' mode. When enabled, the indicator calculates the
Linear Regression on logarithmic data. Mathematically, this
transforms the baseline into an **Exponential Regression Curve**,
making it ideal for analyzing assets with compounding growth
characteristics (constant percentage trend).
4. **Full Divergence Suite (Class A, B, C):** The indicator's
primary feature is its integrated divergence engine. It
automatically detects and plots all three major divergence
classes between price and the Z-Score:
- Regular (A): Signals potential trend exhaustion and reversals.
- Hidden (B): Signals potential trend continuations during pullbacks.
- Exaggerated (C): Signals weakness at double tops/bottoms.
5. **Divergence Filtering and Visualization:**
- **Price Tolerance Filter:** Divergence detection is enhanced
with a percentage-based price tolerance (`pivPrcTol`) to
filter out insignificant market noise, leading to more
robust signals.
- **Persistent Visualization:** Divergence markers are plotted
for the entire duration of the signal and are visually
anchored to the oscillator level of the confirming pivot.
- **Flexible Pivot Algorithms:** Supports various underlying
mathematical models for pivot detection provided by the
core library
6. **Note on Confirmation (Lag):** Divergence signals rely on a
pivot confirmation method to ensure they do not repaint.
- The **Start** of a divergence is only detected *after* the
confirming pivot is fully formed (a delay based on
`Pivot Right Bars`).
- The **End** of a divergence is detected either instantly
(if the signal is invalidated by price action) or with
a delay (when a new, non-divergent pivot is confirmed).
7. **Multi-Timeframe (MTF) Capability:**
- **MTF Calculation:** The Z-Score line *itself* can be calculated on a
higher timeframe, with standard options to handle gaps
(`Fill Gaps`) and prevent repainting (`Wait for...`).
- **Limitation:** The Divergence detection engine (`pivDiv`)
is designed for the active timeframe. Using it in MTF mode
is not recommended as step-data can lead to inaccurate
pivot detection.
8. **Integrated Alerts:** Includes a comprehensive set of built-in
alerts for the Z-Score crossing the neutral line, the configured
Threshold levels, and the start/end of all divergence types.
---
**DISCLAIMER**
1. **For Informational/Educational Use Only:** This indicator is
provided for informational and educational purposes only. It does
not constitute financial, investment, or trading advice, nor is
it a recommendation to buy or sell any asset.
2. **Use at Your Own Risk:** All trading decisions you make based on
the information or signals generated by this indicator are made
solely at your own risk.
3. **No Guarantee of Performance:** Past performance is not an
indicator of future results. The author makes no guarantee
regarding the accuracy of the signals or future profitability.
4. **No Liability:** The author shall not be held liable for any
financial losses or damages incurred directly or indirectly from
the use of this indicator.
5. **Signals Are Not Recommendations:** The alerts and visual signals
(e.g., crossovers) generated by this tool are not direct
recommendations to buy or sell. They are technical observations
for your own analysis and consideration. インジケーター

Vietnamese Stock: Discount Linear Regression Liquidity GrabThe Discount Linear Regression Liquidity Grab is a sophisticated technical analysis tool that combines statistical trend analysis with Premium/Discount Zone and Price Action logic. Unlike standard Linear Regression Channels that repaint or stretch indefinitely, this indicator is dynamic: it automatically detects volatility breakouts to "reset" the channel, creating distinct market "Sections."
This tool is designed to help traders identify trend exhaustion, fair value gaps (FVGs), and high-probability reversal or continuation zones using two distinct built-in strategies.
Key Features
1. Dynamic Channel Resets
The core engine calculates a Linear Regression Channel based on a Pearson R coefficient and Deviation multipliers.
- How it works: When price breaks out of the Upper or Lower Deviation bands, the script recognizes a shift in momentum. It "locks" the previous channel and begins calculating a new one from the breakout point.
- Benefit: This creates a historical map of market structure, showing you exactly where previous trends began and ended.
2. Smart Money Concepts (SMC) Integration
For every completed section (channel), the indicator automatically highlights:
Highest High & Lowest Low Boxes: Identifies the structural range of the previous move.
- Gaps & FVGs: Automatically draws boxes for Fair Value Gaps and Price Gaps within the channel, acting as potential magnets for price.
3. The Discount Zone (New Feature)
The indicator projects a Discount Area (Red Box) from the previous section's midline down to its lowest low.
- Logic: This box represents the "Discount" pricing relative to the previous move.
- Behavior: The box extends to the right until price successfully "grabs liquidity" (closes below the midline/red line). Once the grab occurs, the box stops extending, marking that the liquidity event is complete.
Built-In Strategies
This indicator includes two automated strategy signals based on the interaction between current price and historical sections.
Strategy 1: Breakout & Retest (Trend Continuation)
This strategy looks for a classic resistance-turned-support setup.
- Breakout: Price closes above the Highest High of a previous section (Triangle Up).
- Retest: Price pulls back and closes at or below that breakout level (Triangle Down).
- Confirmation: Price breaks above the high of the initial breakout candle (Green Background).
Strategy 2: Midline Reclaim (Mean Reversion / Discount Buy)
This strategy focuses on buying from the "Discount" zone.
- Liquidity Grab: Price drops below the Midline (Red Line) of a previous section, entering the Discount Zone.
- Reclaim: Price closes back above the Midline, signaling that the dip was bought up.
Signal: A Diamond shape and Teal Background appear.
How to Use
- Trend Trading: Use the Dynamic Channels to visualize the current slope. If the channel is angling up, look for long setups.
- Confluence: Use the Discount Zones and FVG boxes as areas of interest. If price enters a Red Discount Box and forms a reversal pattern, it is a high-probability entry.
- Stop Loss Placement: The Lowest Low boxes of previous sections serve as excellent invalidation points for long positions.
Alerts
The indicator comes with pre-configured alerts for:
- Strategy 1 Confirmation.
- Strategy 2 Midline Reclaim.
- New Channel Formation (Trend Reset).
- Liquidity Grab Events. インジケーター

Advanced Linear Regression Pro [PointAlgo]Advanced Linear Regression Pro is an open-source tool designed to visualize market structure using linear regression, volatility bands, and optional volume-weighted calculations.
The indicator expands the concept of regression channels by adding higher-timeframe confluence, slope analysis, imbalance detection, and breakout highlighting.
Key Features
• Volume-Weighted Regression
Weights the regression curve based on volume to highlight periods of strong participation.
• Dynamic Standard-Deviation Bands
Upper and lower bands are derived from volatility to help visualize potential expansion or contraction zones.
• Multi-Timeframe (MTF) Regression
Plots higher-timeframe regression lines and bands for additional trend context.
• Slope Strength Analysis
Helps identify whether the current regression slope is trending upward, downward, or in a neutral range.
• Order Flow Imbalance Detection
Highlights bars where price and volume move unusually fast, which may indicate liquidity voids or imbalance zones.
• Breakout Markers
Shows simple visual markers when the price closes beyond volatility bands with volume confirmation.
These are visual signals only, not trading signals.
How to Use
This indicator is meant for visual market analysis, such as:
Observing trend direction through regression slope
Spotting volatility expansions
Comparing price against higher-timeframe regression structure
Identifying areas where price moves rapidly with volume
It can be used on any market or timeframe.
No part of this script is intended as financial advice or a complete trading system. インジケーター

Pulse RSI | Lyro RSPulse RSI | Lyro RS
The Pulse RSI is a momentum oscillator that enhances the traditional RSI by incorporating volume-weighted price and linear regression. It generates multiple trading signals, including trend shifts, overbought/oversold conditions, and custom threshold levels.
By integrating both price and volume into its calculation, Pulse RSI is more robust and responsive than the standard RSI. This helps you identify trends faster, spot potential reversals sooner, and set up custom alerts based on your own strategy.
Key Features
Four Signal Types:
Type 1 (Trend): Triggers when the indicator's current value crosses its previous value, highlighting short-term momentum shifts.
Type 2 (Midline Trend): The classic midline cross. A bullish bias is indicated above 50, while a bearish bias is indicated below 50.
Type 3 (Overbought/Oversold): Flags potential reversal zones, suggesting where buying or selling opportunities may emerge.
Type 4 (Custom Thresholds): This type lets you define your own threshold levels. Instead of following a trend, use it to mark your specific conditions for a reversal. For example, set a long reversal at a low level (e.g., 5) for an early buy signal, or a short reversal at a high level (e.g., 80) for an early sell signal.
Calculation Method:
The indicator uses a volume-weighted price (Close * High * Low) and applies linear regression to smooth the data. This creates a unique and more stable oscillator, avoiding the chaotic movement seen in others.
Color System:
Choose from multiple color themes like Classic, Mystic, Accented, and Royal, or create your own custom colors for bullish and bearish signals.
Visual Plotting:
Features a clear plot with a glow effect, a midline, adjustable threshold lines, and shapes/labels to mark long/short and overbought/oversold signals.
Alerts:
Instant alerts are available for every signal type, which you can quickly enable based on your trading conditions.
How It Works:
Core Calculation
The indicator calculates a volume-weighted price using (Close * High * Low) multiplied by the absolute volume. This value is then smoothed with linear regression and converted into an oscillator, normalized to a 0-100 scale.
Trading Logic:
Bullish Signals: Trigger when the main plot line crosses above a key level—be it the previous value, the 50 midline, or a custom threshold.
Bearish Signals: Trigger when the main plot line crosses below a key level.
Visual Logic:
The system displays a main plot line, colors candles, and plots signal shapes, all customizable through a variety of color schemes.
Practical Use
Trend Confirmation (Types 1 & 2): Use Type 1 for early momentum shifts and Type 2 to confirm the overall trend direction.
Reversals (Type 3): Consider long entries when oversold signals fire, suggesting an asset is undervalued. Look for exits at overbought signals, which suggest a potential downward reversal.
Custom Thresholds (Type 4): Set tight thresholds to catch early trends and reversals. Be aware that more sensitive settings may also increase false positives.
Customization:
Adjust the Length: A higher setting makes the indicator more suited for long-term trends, while a lower setting makes it more sensitive for short-term moves.
Enable/Disable Signals: Turn the four signal types on or off to match your trading style.
Set Your Levels: Fully adjustable thresholds for Type 4 long/short conditions.
Choose Your Colors: Select from a variety of color schemes for all bullish and bearish elements.
⚠️ Disclaimer
This indicator is a tool for technical analysis and does not guarantee results. It should be used alongside other analysis methods and solid risk management practices. The creators are not responsible for any financial decisions made based on its signals. インジケーター

Volume Weighted Volatility RegimeThe Volume-Weighted Volatility Regime (VWVR) is a market analysis tool that dissects total volatility to classify the current market 'character' or 'regime'. Using a Linear Regression model, it decomposes volatility into Trend, Residual (mean-reversion), and Within-Bar (noise) components.
Key Features:
Seven-Stage Regime Classification: The indicator's primary output is a regime value from -3 to +3, identifying the market state:
+3 (Strong Bull Trend): High directional, upward volatility.
+2 (Choppy Bull): Moderate upward trend with noise.
+1 (Quiet Bull): Low volatility, slight upward drift.
0 (Neutral): No clear directional bias.
-1 (Quiet Bear): Low volatility, slight downward drift.
-2 (Choppy Bear): Moderate downward trend with noise.
-3 (Strong Bear Trend): High directional, downward volatility.
Advanced Volatility Decomposition: The regime is derived from a three-component volatility model that separates price action into Trend (momentum), Residual (mean-reversion), and Within-Bar (noise) variance. The classification is determined by comparing the 'Trend' ratio against the user-defined 'Trend Threshold' and 'Quiet Threshold'.
Dual-Level Analysis: The indicator analyzes market character on two levels simultaneously:
Inter-Bar Regime (Background Color): Based on the main StdDev Length, showing the overall market character.
Intra-Bar Regime (Column Color): Based on a high-resolution analysis within each single bar ('Intra-Bar Timeframe'), showing the micro-structural character.
Calculation Options:
Statistical Model: The 'Estimate Bar Statistics' option (enabled by default) uses a statistical model ('Estimator') to perform the decomposition. (Assumption: In this mode, the Source input is ignored, and an estimated mean for each bar is used instead).
Normalization: An optional 'Normalize Volatility' setting calculates an Exponential Regression Curve (log-space).
Volume Weighting: An option (Volume weighted) applies volume weighting to all volatility calculations.
Multi-Timeframe (MTF) Capability: The entire dual-level analysis can be run on a higher timeframe (using the Timeframe input), with standard options to handle gaps (Fill Gaps) and prevent repainting (Wait for...).
Integrated Alerts: Includes 22 comprehensive alerts that trigger whenever the 'Inter-Bar Regime' or the 'Intra-Bar Regime' crosses one of the key thresholds (e.g., 'Regime crosses above Neutral Line'), or when the 'Intra-Bar Dominance' crosses the 50% mark.
Caution: Real-Time Data Behavior (Intra-Bar Repainting) This indicator uses high-resolution intra-bar data. As a result, the values on the current, unclosed bar (the real-time bar) will update dynamically as new intra-bar data arrives. This behavior is normal and necessary for this type of analysis. Signals should only be considered final after the main chart bar has closed.
DISCLAIMER
For Informational/Educational Use Only: This indicator is provided for informational and educational purposes only. It does not constitute financial, investment, or trading advice, nor is it a recommendation to buy or sell any asset.
Use at Your Own Risk: All trading decisions you make based on the information or signals generated by this indicator are made solely at your own risk.
No Guarantee of Performance: Past performance is not an indicator of future results. The author makes no guarantee regarding the accuracy of the signals or future profitability.
No Liability: The author shall not be held liable for any financial losses or damages incurred directly or indirectly from the use of this indicator.
Signals Are Not Recommendations: The alerts and visual signals (e.g., crossovers) generated by this tool are not direct recommendations to buy or sell. They are technical observations for your own analysis and consideration. インジケーター

Volume Weighted Intra Bar LR Standard DeviationThis indicator analyzes market character by providing a detailed view of volatility. It applies a Linear Regression model to intra-bar price action, dissecting the total volatility of each bar into three distinct components.
Key Features:
Three-Component Volatility Decomposition: By analyzing a lower timeframe ('Intra-Bar Timeframe'), the indicator separates each bar's volatility into:
Trend Volatility (Green/Red): Volatility explained by the intra-bar linear regression slope (Momentum).
Residual Volatility (Yellow): Volatility from price oscillating around the intra-bar trendline (Mean-Reversion).
Within-Bar Volatility (Blue): Volatility derived from the range of each intra-bar candle (Noise/Choppiness).
Layered Column Visualization: The indicator plots these components as a layered column chart. The size of each colored layer visually represents the dominance of each volatility character.
Dual Display Modes: The indicator offers two modes to visualize this decomposition:
Absolute Mode: Displays the total standard deviation as the column height, showing the absolute magnitude of volatility and the contribution of each component.
Normalized Mode: Displays the components as a 100% stacked column chart (scaled from 0 to 1), focusing purely on the percentage ratio of Trend, Residual, and Noise.
Calculation Options:
Statistical Model: The 'Estimate Bar Statistics' option (enabled by default) uses a statistical model ('Estimator') to perform the decomposition. (Assumption: In this mode, the Source input is ignored, and an estimated mean for each bar is used instead).
Normalization: An optional 'Normalize Volatility' setting calculates an Exponential Regression Curve (log-space).
Volume Weighting: An option (Volume weighted) applies volume weighting to all intra-bar calculations.
Multi-Component Pivot Detection: Includes a pivot detector that identifies significant turning points (highs and lows) in both the Total Volatility and the Trend Volatility Ratio. (Note: These pivots are only plotted when 'Plot Mode' is set to 'Absolute').
Note on Confirmation (Lag): Pivot signals are confirmed using a lookback method. A pivot is only plotted after the Pivot Right Bars input has passed, which introduces an inherent lag.
Multi-Timeframe (MTF) Capability:
MTF Analysis: The entire intra-bar analysis can be run on a higher timeframe (using the Timeframe input), with standard options to handle gaps (Fill Gaps) and prevent repainting (Wait for...).
Limitation: The Pivot detection (Calculate Pivots) is disabled if a Higher Timeframe (HTF) is selected.
Integrated Alerts: Includes 9 comprehensive alerts for:
Volatility character changes (e.g., 'Character Change from Noise to Trend').
Dominant character emerging (e.g., 'Bullish Trend Character Emerging').
Total Volatility pivot (High/Low) detection.
Trend Volatility pivot (High/Low) detection.
Caution! Real-Time Data Behavior (Intra-Bar Repainting) This indicator uses high-resolution intra-bar data. As a result, the values on the current, unclosed bar (the real-time bar) will update dynamically as new intra-bar data arrives. This behavior is normal and necessary for this type of analysis. Signals should only be considered final after the main chart bar has closed.
DISCLAIMER
For Informational/Educational Use Only: This indicator is provided for informational and educational purposes only. It does not constitute financial, investment, or trading advice, nor is it a recommendation to buy or sell any asset.
Use at Your Own Risk: All trading decisions you make based on the information or signals generated by this indicator are made solely at your own risk.
No Guarantee of Performance: Past performance is not an indicator of future results. The author makes no guarantee regarding the accuracy of the signals or future profitability.
No Liability: The author shall not be held liable for any financial losses or damages incurred directly or indirectly from the use of this indicator.
Signals Are Not Recommendations: The alerts and visual signals (e.g., crossovers) generated by this tool are not direct recommendations to buy or sell. They are technical observations for your own analysis and consideration. インジケーター
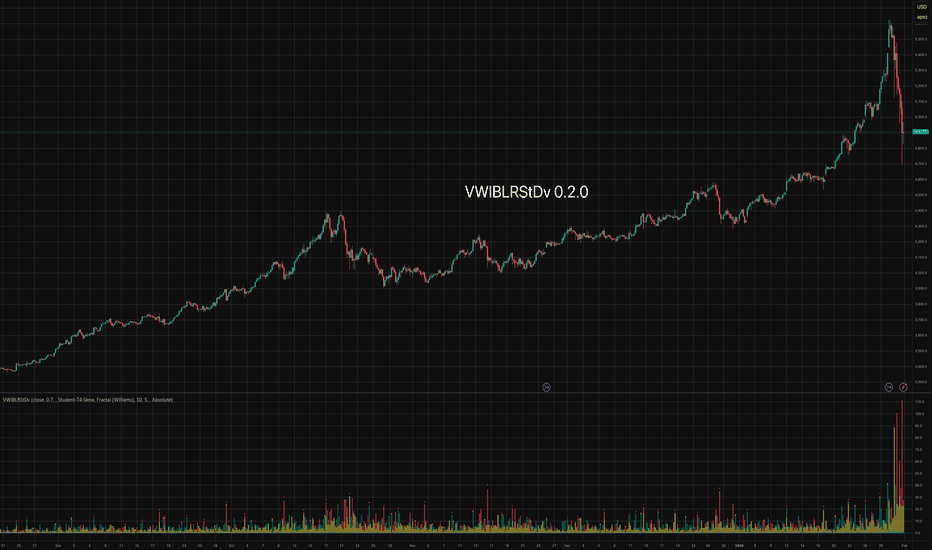
Volume Weighted LR Standard DeviationThis indicator analyzes market character by decomposing total volatility into three distinct, interpretable components based on a Linear Regression model.
Key Features:
Three-Component Volatility Decomposition: The indicator separates volatility based on the 'Estimate Bar Statistics' option.
Standard Mode (Estimate Bar Statistics = OFF): Calculates volatility based on the selected Source (dies führt hauptsächlich zu 'Trend'- und 'Residual'-Volatilität).
Decomposition Mode (Estimate Bar Statistics = ON): The indicator uses a statistical model ('Estimator') to calculate within-bar volatility. (Assumption: In this mode, the Source input is ignored, and an estimated mean for each bar is used instead). This separates volatility into:
Trend Volatility (Green/Red): Volatility explained by the regression's slope (Momentum).
Residual Volatility (Yellow): Volatility from price oscillating around the regression line (Mean-Reversion).
Within-Bar Volatility (Blue): Volatility from the high-low range of each bar (Noise/Choppiness).
Dual Display Modes: The indicator offers two modes to visualize this decomposition:
Absolute Mode: Displays the total standard deviation as a stacked area chart, partitioned by the variance ratio of the three components.
Normalized Mode: Displays the direct variance ratio (proportion) of each component relative to the total (0-1), ideal for identifying the dominant market character.
Calculation Options:
Normalization: An optional 'Normalize Volatility' setting calculates an Exponential Regression Curve (log-space), making the analysis suitable for growth assets.
Volume Weighting: An option (Volume weighted) applies volume weighting to all regression and volatility calculations.
Multi-Component Pivot Detection: Includes a pivot detector that identifies significant turning points (highs and lows) in both the Total Volatility and the Trend Volatility Ratio. (Note: These pivots are only plotted when 'Plot Mode' is set to 'Absolute').
Note on Confirmation (Lag): Pivot signals are confirmed using a lookback method. A pivot is only plotted after the Pivot Right Bars input has passed, which introduces an inherent lag.
Multi-Timeframe (MTF) Capability:
MTF Volatility Lines: The volatility lines can be calculated on a higher timeframe, with standard options to handle gaps (Fill Gaps) and prevent repainting (Wait for...).
Limitation: The Pivot detection (Calculate Pivots) is disabled if a Higher Timeframe (HTF) is selected.
Integrated Alerts: Includes 9 comprehensive alerts for:
Volatility character changes (e.g., 'Character Change from Noise to Trend').
Dominant character emerging (e.g., 'Bullish Trend Character Emerging').
Total Volatility pivot (High/Low) detection.
Trend Volatility pivot (High/Low) detection.
DISCLAIMER
For Informational/Educational Use Only: This indicator is provided for informational and educational purposes only. It does not constitute financial, investment, or trading advice, nor is it a recommendation to buy or sell any asset.
Use at Your Own Risk: All trading decisions you make based on the information or signals generated by this indicator are made solely at your own risk.
No Guarantee of Performance: Past performance is not an indicator of future results. The author makes no guarantee regarding the accuracy of the signals or future profitability.
No Liability: The author shall not be held liable for any financial losses or damages incurred directly or indirectly from the use of this indicator.
Signals Are Not Recommendations: The alerts and visual signals (e.g., crossovers) generated by this tool are not direct recommendations to buy or sell. They are technical observations for your own analysis and consideration. インジケーター
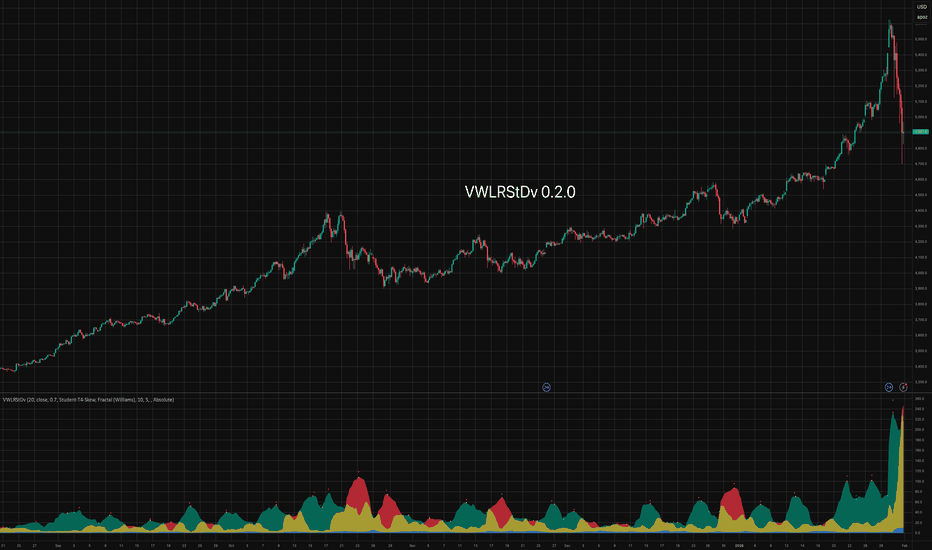
Volume Weighted Linear Regression BandThe Volume-Weighted Linear Regression Band (VWLRBd) is a volatility channel that uses a Linear Regression line as its dynamic baseline. Its primary feature is the decomposition of total volatility into two distinct components, visualized as layered bands.
Key Features:
Volatility Decomposition: The indicator separates volatility based on the 'Estimate Bar Statistics' option.
Standard Mode (Estimate Bar Statistics = OFF): The indicator functions as a standard (Volume-Weighted) Linear Regression Channel. It plots a single set of bands based on the standard deviation of the residuals (the error between the Source price and the regression line).
Decomposition Mode (Estimate Bar Statistics = ON): The indicator uses a statistical model ('Estimator') to calculate within-bar volatility. (Assumption: In this mode, the Source input is ignored, and an estimated mean for each bar is used for the regression). This mode displays two sets of bands:
Inner Bands: Show only the contribution of the 'residual' (trend noise) volatility, calculated proportionally.
Outer Bands: Show the total volatility (the sum of residual and within-bar components).
Regression Baseline (Linear / Exponential): The central line is a (Volume-Weighted) Linear Regression curve. An optional 'Normalize' mode performs all calculations in logarithmic space, transforming the baseline into an Exponential Regression Curve and the bands into constant percentage deviations, suitable for analyzing growth assets.
Volume Weighting: An option (Volume weighted) allows for volume to be incorporated into the calculation of both the regression baseline and the volatility decomposition, giving more influence to high-participation bars.
Multi-Timeframe (MTF) Engine: The indicator includes an MTF conversion block. When a Higher Timeframe (HTF) is selected, advanced options become available: Fill Gaps handles data gaps, and Wait for timeframe to close prevents repainting by ensuring the indicator only updates when the HTF bar closes.
Integrated Alerts: Includes a full set of built-in alerts for the source price crossing over or under the central regression line and the outermost calculated volatility band.
DISCLAIM_
For Informational/Educational Use Only: This indicator is provided for informational and educational purposes only. It does not constitute financial, investment, or trading advice, nor is it a recommendation to buy or sell any asset.
Use at Your Own Risk: All trading decisions you make based on the information or signals generated by this indicator are made solely at your own risk.
No Guarantee of Performance: Past performance is not an indicator of future results. The author makes no guarantee regarding the accuracy of the signals or future profitability.
No Liability: The author shall not be held liable for any financial losses or damages incurred directly or indirectly from the use of this indicator.
Signals Are Not Recommendations: The alerts and visual signals (e.g., crossovers) generated by this tool are not direct recommendations to buy or sell. They are technical observations for your own analysis and consideration. インジケーター

Volume Weighted Linear Regression ChannelThis indicator plots a dynamic channel around a Linear Regression trendline. It provides a framework for identifying the prevailing trend and assessing price extremes based on volatility.
Key Features:
Linear Regression Baseline: The channel's centerline is a (Volume-Weighted) Linear Regression line. This line represents the 'best fit' for the recent price action, serving as a responsive baseline for the trend.
Volatility Decomposition: The indicator's primary feature is its ability to decompose volatility, controlled by the 'Estimate Bar Statistics' option.
Standard Mode (Estimate Bar Statistics = OFF): Calculates a standard linear regression channel. The bands represent the standard deviation of the residuals (the error) between the Source price and the regression line.
Decomposition Mode (Estimate Bar Statistics = ON): The indicator uses a statistical model ('Estimator') to calculate within-bar volatility. (Assumption: In this mode, the Source input is ignored, and an estimated mean for each bar is used for the regression). This mode displays two sets of bands:
Inner Bands: Show only the contribution of the 'residual' (trend noise) volatility, calculated proportionally.
Outer Bands: Show the total volatility (the sum of residual and within-bar components).
Volume Weighting: An option (Volume weighted) allows for volume to be incorporated into the calculation of both the linear regression and the volatility decomposition, giving more influence to high-participation bars.
Trend Projection: The calculated channel is plotted as a projection, which can be extended forward (Extend Forward) and backward (Extend Backward) in time to provide a visual guide for potential support and resistance.
Integrated Alerts: Includes a full set of built-in alerts for the Source price crossing over or under the calculated upper band, lower band, and the central regression line.
DISCLAIMER
For Informational/Educational Use Only: This indicator is provided for informational and educational purposes only. It does not constitute financial, investment, or trading advice, nor is it a recommendation to buy or sell any asset.
Use at Your Own Risk: All trading decisions you make based on the information or signals generated by this indicator are made solely at your own risk.
No Guarantee of Performance: Past performance is not an indicator of future results. The author makes no guarantee regarding the accuracy of the signals or future profitability.
No Liability: The author shall not be held liable for any financial losses or damages incurred directly or indirectly from the use of this indicator.
Signals Are Not Recommendations: The alerts and visual signals (e.g., crossovers) generated by this tool are not direct recommendations to buy or sell. They are technical observations for your own analysis and consideration. インジケーター
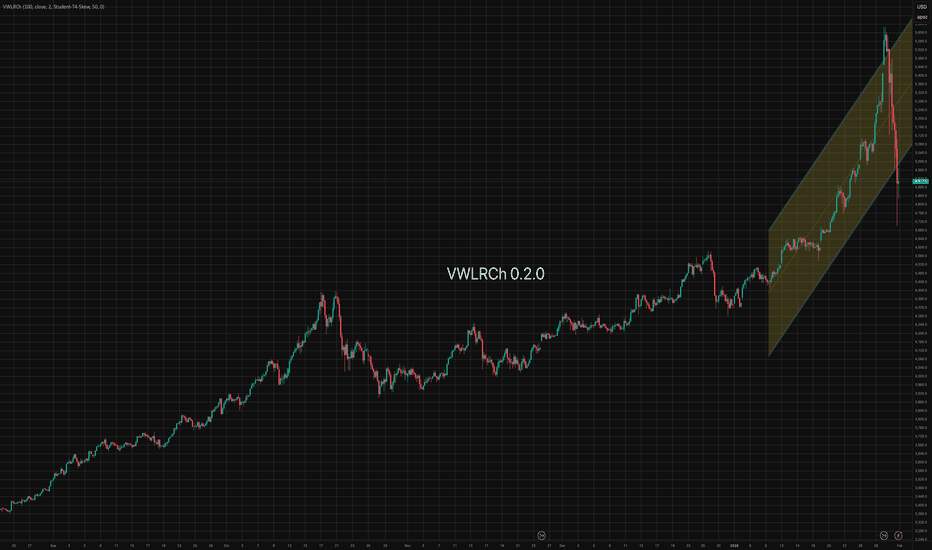
Squeeze Momentum Regression Clouds [SciQua]╭──────────────────────────────────────────────╮
☁️ Squeeze Momentum Regression Clouds
╰──────────────────────────────────────────────╯
🔍 Overview
The Squeeze Momentum Regression Clouds (SMRC) indicator is a powerful visual tool for identifying price compression , trend strength , and slope momentum using multiple layers of linear regression Clouds. Designed to extend the classic squeeze framework, this indicator captures the behavior of price through dynamic slope detection, percentile-based spread analytics, and an optional UI for trend inspection — across up to four customizable regression Clouds .
────────────────────────────────────────────────────────────
╭────────────────╮
⚙️ Core Features
╰────────────────╯
Up to 4 Regression Clouds – Each Cloud is created from a top and bottom linear regression line over a configurable lookback window.
Slope Detection Engine – Identifies whether each band is rising, falling, or flat based on slope-to-ATR thresholds.
Spread Compression Heatmap – Highlights compressed zones using yellow intensity, derived from historical spread analysis.
Composite Trend Scoring – Aggregates directional signals from each Cloud using your chosen weighting model.
Color-Coded Candles – Optional candle coloring reflects the real-time composite score.
UI Table – A toggleable info table shows slopes, compression levels, percentile ranks, and direction scores for each Cloud.
Gradient Cloud Styling – Apply gradient coloring from Cloud 1 to Cloud 4 for visual slope intensity.
Weight Aggregation Options – Use equal weighting, inverse-length weighting, or max pooling across Clouds to determine composite trend strength.
────────────────────────────────────────────────────────────
╭──────────────────────────────────────────╮
🧪 How to Use the Indicator
1. Understand Trend Bias with Cloud Colors
╰──────────────────────────────────────────╯
Each Cloud changes color based on its current slope:
Green indicates a rising trend.
Red indicates a falling trend.
Gray indicates a flat slope — often seen during chop or transitions.
Cloud 1 typically reflects short-term structure, while Cloud 4 represents long-term directional bias. Watch for multi-Cloud alignment — when all Clouds are green or red, the trend is strong. Divergence among Clouds often signals a potential shift.
────────────────────────────────────────────────────────────
╭───────────────────────────────────────────────╮
2. Use Compression Heat to Anticipate Breakouts
╰───────────────────────────────────────────────╯
The space between each Cloud’s top and bottom regression lines is measured, normalized, and analyzed over time. When this spread tightens relative to its history, the script highlights the band with a yellow compression glow .
This visual cue helps identify squeeze zones before volatility expands. If you see compression paired with a changing slope color (e.g., gray to green), this may indicate an impending breakout.
────────────────────────────────────────────────────────────
╭─────────────────────────────────╮
3. Leverage the Optional Table UI
╰─────────────────────────────────╯
The indicator includes a dynamic, floating table that displays real-time metrics per Cloud. These include:
Slope direction and value , with historical Min/Max reference.
Top and Bottom percentile ranks , showing how price sits within the Cloud range.
Current spread width , compared to its historical norms.
Composite score , which blends trend, slope, and compression for that Cloud.
You can customize the table’s position, theme, transparency, and whether to show a combined summary score in the header.
────────────────────────────────────────────────────────────
╭─────────────────────────────────────────────╮
4. Analyze Candle Color for Composite Signals
╰─────────────────────────────────────────────╯
When enabled, the indicator colors candles based on a weighted composite score. This score factors in:
The signed slope of each Cloud (up, down, or flat)
The percentile pressure from the top and bottom bands
The degree of spread compression
Expect green candles in bullish trend phases, red candles during bearish regimes, and gray candles in mixed or low-conviction zones.
Candle coloring provides a visual shorthand for market conditions , useful for intraday scanning or historical backtesting.
────────────────────────────────────────────────────────────
╭────────────────────────╮
🧰 Configuration Guidance
╰────────────────────────╯
To tailor the indicator to your strategy:
Use Cloud lengths like 21, 34, 55, and 89 for a balanced multi-timeframe view.
Adjust the slope threshold (default 0.05) to control how sensitive the trend coloring is.
Set the spread floor (e.g., 0.15) to tune when compression is detected and visualized.
Choose your weighting style : Inverse Length (favor faster bands), Equal, or Max Pooling (most aggressive).
Set composite weights to emphasize trend slope, percentile bias, or compression—depending on your market edge.
────────────────────────────────────────────────────────────
╭────────────────╮
✅ Best Practices
╰────────────────╯
Use aligned Cloud colors across all bands to confirm trend conviction.
Combine slope direction with compression glow for early breakout entry setups.
In choppy markets, watch for Clouds 1 and 2 turning flat while Clouds 3 and 4 remain directional — a sign of potential trend exhaustion or consolidation.
Keep the table enabled during backtesting to manually evaluate how each Cloud behaved during price turns and consolidations.
────────────────────────────────────────────────────────────
╭───────────────────────╮
📌 License & Usage Terms
╰───────────────────────╯
This script is provided under the Creative Commons Attribution-NonCommercial 4.0 International License .
✅ You are allowed to:
Use this script for personal or educational purposes
Study, learn, and adapt it for your own non-commercial strategies
❌ You are not allowed to:
Resell or redistribute the script without permission
Use it inside any paid product or service
Republish without giving clear attribution to the original author
For commercial licensing , private customization, or collaborations, please contact Joshua Danford directly. インジケーター