Periodic Linear Regressions [LuxAlgo]The Periodic Linear Regressions (PLR) indicator calculates linear regressions periodically (similar to the VWAP indicator) based on a user-set period (anchor).
This allows for estimating underlying trends in the price, as well as providing potential supports/resistances.
🔶 USAGE
The Periodic Linear Regressions indicator calculates a linear regression over a user-selected interval determined from the selected "Anchor Period".
The PLR can be visualized as a regular linear regression (St
線形回帰
Adaptive LSMA Regression OscillatorOverview:
The Adaptive LSMA Regression Oscillator is an open-source technical analysis tool designed to reflect market price deviations from an adaptive least squares moving average (LSMA). The adaptive length of the LSMA changes dynamically based on the volatility of the market, making the indicator responsive to different market conditions.
Key Features:
Adaptive Length Adjustment : The base length of the LSMA is adjusted based on market volatility, measured by the Average True Range (A
インジケーター
Magic Linear Regression Channel [MW]Introduction
The Magic Linear Regression Channel indicator provides users with a way to quickly include a linear regression channel ANYWHERE on their chart, in order to find channel breakouts and bounces within any time period. It uses a novel method that allows users to adjust the start and end period of the regression channel in order to quickly make adjustments faster, with fewer steps, and with more precision than with any other linear regression channel tool. It includes Fibonacci bands
インジケーター
Fibonacci Linear Regression Bands[Pinescriptlabs]🎯 This script is designed to draw Fibonacci-based linear regression bands.
It calculates and draws a linear regression channel and its Fibonacci levels across different time frames (5m, 15m, 30m, and 4h).
📊 How to use it?
🔍 Multidimensional Analysis
This strategy allows you to view the market from a multidimensional perspective, integrating long-term trends with short-term price action. By doing so, you can dynamically adjust your trades based on market developments, moving between time frames
インジケーター
FVG Price & Volume Graph [LuxAlgo]The FVG Price & Volume Graph tool plot recently detected fair value gaps relative to the volume traded within their area during their formation. This allows us to effectively visualize significant fair value gaps caused by high liquidity.
The indicator also returns levels from the fair value gaps areas average with the highest associated volume.
Do note that the indicator can consider the chart's visible range when being computed, which will recalculate the indicator when the chart's visible r
インジケーター
Linear Regression ChannelLinear Regression Channel with Logarithmic Scale Option
This advanced Linear Regression Channel indicator offers traders a powerful tool for technical analysis, with unique features that set it apart from standard implementations.
Key Features:
Logarithmic Scale Option: One of the most distinctive aspects of this indicator is the ability to switch between classic and logarithmic scales. This feature is particularly valuable for long-term analysis, as it ensures that equal percentage changes
インジケーター
Quadratic Kernel with Quadratic Divergence [PinescriptLabs]This indicator combines a quadratic kernel regression with adaptive deviation bands to provide a unique view of market trends.
Key Features:
**Customizable Parameters:**
- Regression Period: Adjusts the sensitivity of the central line (default 50).
- Time Deformation: Modifies the weight of recent vs. older data (default 1.0). Increasing the "Time Deformation" makes more recent data more relevant, while decreasing it gives more weight to older data in the regression calculation.
- Confidence
インジケーター
Multiple Non-Linear Regression [ChartPrime]This indicator is designed to perform multiple non-linear regression analysis using four independent variables: close, open, high, and low prices. Here's a breakdown of its components and functionalities:
Inputs:
Users can adjust several parameters:
Normalization Data Length: Length of data used for normalization.
Learning Rate: Rate at which the algorithm learns from errors.
Smooth?: Option to smooth the output.
Smooth Length: Length of smoothing if enabled.
Define start coefficien
インジケーター
Multi-Timeframe Linear Regression Channel (Pinescriptlabs)This script combines multiple timeframes for visualizing linear regression channels in a single chart, allowing us to obtain a holistic view of price behavior across different timeframes (5m, 15m, 30m, and 4h). It facilitates the identification of trends and support/resistance levels across various time horizons. This multi-timeframe approach is useful because it helps confirm signals and detect potential divergences.
Components and Their Interaction
Linear Regression: Calculates the regressio
インジケーター
Linear Regression Oscillator [ChartPrime]Linear Regression Oscillator Indicator
Overview:
The Linear Regression Oscillator is a custom TradingView indicator designed to provide insights into potential mean reversion and trend conditions. By calculating a linear regression on the closing prices over a user-defined period, this oscillator helps identify overbought and oversold levels and highlights trend changes. The indicator also offers visual cues and color-coded price bars to aid in quick decision-making.
Key Features:
◆ Cus
Linear Regression Trend ChannelThe "Linear Regression Trend Channel" is a technical indicator designed to illustrate price trends and their volatility using linear regression. This indicator calculates the main linear regression line based on the user-defined period length and computes the standard deviation to form a trend channel.
Key Features:
- Linear Regression Calculation: Computes the linear regression line based on the selected price data source and the defined period length.
- Slope and Intercept Calculation: Calcu
インジケーター
Trend Maestro - Linear Regression & Volatility BandsTrend Maestro - Linear Regression & Volatility Bands
Description:
The "Trend Maestro - Linear Regression & Volatility Bands" indicator is meticulously designed to provide traders with a clear understanding of market trends through the application of linear regression techniques and enhanced market data visualization. This tool is essential for traders looking to interpret long-term trends and market stability. Here's how the indicator functions and what makes it a unique addition to your tra
インジケーター
The Next Pivot (With History) [Mxwll]Introducing "The Next Pivot (With History)"!
With permission from the author @KioseffTrading
The script "The Next Pivot" has been restructured to show historical projections!
Features
Find the most similar price sequence per time frame change.
Forecast almost any public indicator! Not just price!
Forecast any session i.e. 4Hr, 1Hr, 15m, 1D, 1W
Forecast ZigZag for any session
Spearmen
Pearson
Absolute Difference
Cosine Similarity
Mean Squared Error
Kendall
Forecasted linear
インジケーター
Lin Reg (Linear Regression) Support and Resistance by xxMargauxLin Reg (Linear Regression) Support & Resistance by xxMargaux 💸
This indicator plots three linear regression lines (Lin Reg) on the price chart, providing insights into potential support and resistance levels. It calculates Lin Reg lines based on user-defined lengths and sources.
This indicator's settings were initially configured for MNQ1! (E-Mini Nasdaq 100 futures contracts). But works as intended on any security and on any timeframe.
When price is below a given Lin Reg line, that line wi
インジケーター
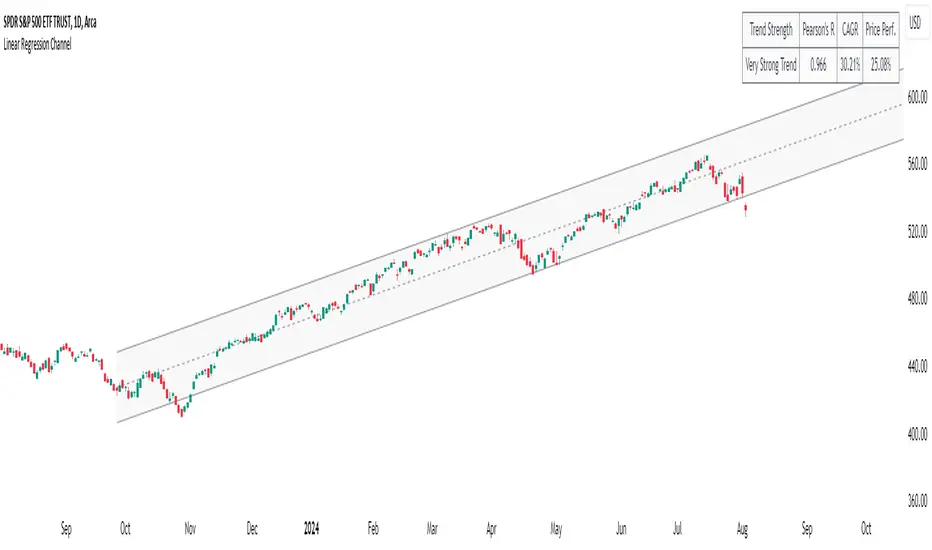
Long-Term Trend DetectorThe Long-Term Trend Detector is a powerful tool designed to identify sustainable trends in price movements, offering significant advantages for traders and investors.
Key Benefits:
1. Projection Confidence: This indicator leverages Pearson's R, a statistical measure that indicates the strength of the linear relationship between price and trend projection. A higher Pearson's R value reflects a stronger correlation, providing increased confidence in the identified trend direction.
2. Adaptive C
インジケーター
Heat Map SeasonsHeat Map Seasons indicator
Indicator offers traders a unique perspective on market dynamics by visualizing seasonal trends and deviations from typical price behavior. By blending regression analysis with a color-coded heat map, this indicator highlights periods of heightened volatility and helps identify potential shifts in market sentiment.
Summer:
In the context of the indicator, "summer" represents a period of heightened volatility and upward price momentum in the market. This is an
Sector ETFs performance overviewThe indicator provides a nuanced view of sector performance through ETF analysis, focusing on long-term price trends and deviations from these trends to gauge relative strength or weakness. It utilizes a methodical approach to smooth out ETF price data and then applies a regression analysis to pinpoint the primary trend direction. By examining how far the current price deviates from this regression line, the indicator identifies potential overbought or oversold conditions within various sectors.
インジケーター
Sector ETF macro trendThe Sector ETF Macro Trend indicator is designed for technical analysis of broad economic trends through sector-specific exchange-traded funds (ETFs). It uses logarithmic price transformation, linear regression, and volatility analysis to examine sector trends and stability, providing a technical basis for analytical assessment.
Core Analysis Techniques
Logarithmic Transformation and Regression: Converts ETF closing prices logarithmically to reveal sector growth patterns and dynamics. Line
インジケーター
Least Median of Squares Regression | ymxbThe Least Median of Squares (LMedS) is a robust statistical method predominantly used in the context of regression analysis. This technique is designed to fit a model to a dataset in a way that is resistant to outliers. Developed as an alternative to more traditional methods like Ordinary Least Squares (OLS) regression, LMedS is distinguished by its focus on minimizing the median of the squares of the residuals rather than their mean. Residuals are the differences between observed and predicted
インジケーター
ATR TrendTL;DR - An average true range (ATR) based trend
ATR trend uses a (customizable) ATR calculation and highest high & lowest low prices to calculate the actual trend. Basically it determines the trend direction by using highest high & lowest low and calculates (depending on the determined direction) the ATR trend by using a ATR based calculation and comparison method.
The indicator will draw one trendline by default. It is also possible to draw a second trendline which shows a 'negative trend'. T
インジケーター
Divergence AnalyzerUnlock the potential of your trading strategy with the Divergence Analyzer, a sophisticated indicator designed to identify divergence patterns between two financial instruments. Whether you're a seasoned trader or just starting, this tool provides valuable insights into market trends and potential trading opportunities.
Key Features:
1. Versatility in Symbol Selection:
- Choose from a wide range of symbols for comparison, including popular indices like XAUUSD and SPX.
- Seamlessly toggle betwe
インジケーター
Adaptive Trend Finder (log)In the dynamic landscape of financial markets, the Adaptive Trend Finder (log) stands out as an example of precision and professionalism. This advanced tool, equipped with a unique feature, offers traders a sophisticated approach to market trend analysis: the choice between automatic detection of the long-term or short-term trend channel.
Key Features:
1. Choice Between Long-Term or Short-Term Trend Channel Detection: Positioned first, this distinctive feature of the Adaptive Trend Finder
Linear Regression Channel 200█ OVERVIEW
This a simplified version of linear regression channel which use length 200 instead of traditional length 100.
█ FEATURES
Color change depends light / dark mode.
█ LIMITATIONS
Limited to source of closing price and max bars back is 1500.
█ SIMILAR
Regression Channel Alternative MTF
Regression Channel Alternative MTF V2
インジケーター
Adaptiv Trend Projection with Dynamic Length RegressionThe Adaptive Trend Projection indicator is a robust tool designed to provide an optimal trend projection calculated in a highly sophisticated manner. By utilizing linear regression lengths ranging from 20 to 200, this indicator estimates the duration of the trend by dynamically adjusting the projection length based on the calculated trend's strength.
Key Features:
1. Dynamic Length Adjustment: The indicator intelligently adapts the projection length between 20 and 200 using linear regression,
インジケーター