MB-MACD## Description
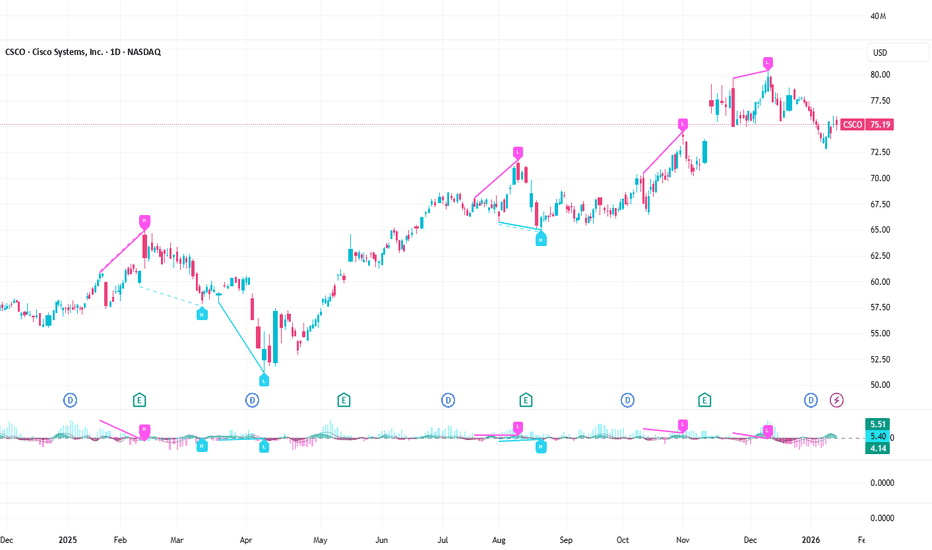
**MB-MACD** is a custom Pine Script indicator designed to enhance momentum analysis by combining a volume-based "Main Buy Ratio" (MB) calculation with a traditional MACD oscillator. The MB Ratio estimates institutional buying pressure by apportioning volume based on the candle's range and close position, providing a unique proxy for "smart money" flow. This smoothed MB value is then used as the source for MACD computation, allowing for divergence detection between price action, the MB line, and the MACD Histogram.
Key features include:
- **MB Line**: A histogram-style plot showing smoothed buy/sell ratio, colored bullishly (teal) or bearishly (pink) based on direction.
- **MACD Histogram**: Standard MACD applied to the MB source, with optional smoothing.
- **Divergence Detection**: Identifies bullish and bearish divergences on both the MB line and MACD Histogram, with configurable filters for momentum decay and zero-line alignment.
- **Visualization Options**: Display divergence lines and labels in the indicator pane or synced as an overlay on the main chart for better context.
- **Alerts**: Triggers for bullish or bearish divergences to notify users of potential reversal setups.
This indicator is particularly useful for swing traders and momentum followers looking to spot hidden divergences that may signal trend reversals or continuations. It emphasizes risk management by highlighting where price and momentum decouple, but remember: divergences are probabilistic signals and should be confirmed with other tools.
As this is a community-shared script, I encourage users to test it thoroughly and provide feedback. If you spot any bugs, calculation errors, or improvements (e.g., edge cases with low-volume symbols or performance issues on certain timeframes), please comment below or reach out—your input helps refine it for everyone!
## User Manual
### Introduction
The **MB-MACD** indicator integrates volume analysis with MACD to detect divergences in price and momentum. The core innovation is the "Main Buy Ratio" (MB), which approximates buying vs. selling volume within each bar based on its range and close position. This MB value is smoothed and fed into a MACD calculation, enabling divergence scans on both the MB line and the resulting MACD Histogram.
Divergences occur when price makes higher highs/lower lows, but the oscillator (MB or Histogram) fails to confirm—often signaling potential reversals. The script offers flexible display options, filters to reduce false positives, and alerts for real-time notifications.
**Important Notes:**
- This is not financial advice; use it for educational purposes and backtest on your symbols/timeframes.
- Works best on liquid stocks or indices with reliable volume data (e.g., daily or higher timeframes).
- Performance may vary on low-volume assets or during after-hours trading.
- If you encounter issues (e.g., no divergences detected or rendering errors), check your chart settings and report them in the comments for community debugging.
### Inputs Explanation
The inputs are grouped for ease of configuration. Adjust them via the indicator's settings panel in TradingView.
#### Core Parameters
- **Show MB Line** (Default: True): Enables/disables the MB Ratio histogram plot.
- **Show MACD Histogram** (Default: True): Enables/disables the MACD line and histogram plots.
- **MB Smoothing (SMA)** (Default: 10, Min: 1): Length for smoothing the raw MB Ratio using a Simple Moving Average (SMA). Higher values reduce noise but may lag.
- **Pivot Lookback Length** (Default: 5, Min: 2): Bars to look back/forward for detecting price pivots (highs/lows) used in divergence logic.
- **Max Lines Kept** (Default: 100, Min: 10): Limits the number of divergence lines/labels to prevent chart clutter.
#### Display Settings
- **Show Lines (Indicator Pane)** (Default: True): Draws divergence lines on the MB line in the indicator pane.
- **Show Labels (Indicator Pane)** (Default: True): Adds labels (e.g., "L" for line divergence) at divergence points in the pane.
- **Show Hist Divergence Lines** (Default: True): Draws dashed lines for MACD Histogram divergences in the pane.
- **Show Hist Divergence Labels** (Default: True): Adds labels (e.g., "H" for histogram divergence) in the pane.
- **Sync Lines to Main Chart (Overlay)** (Default: True): Mirrors divergence lines and labels onto the main price chart for context (slightly offset for visibility).
#### Filters & Tolerance
- **Peak Alignment Tolerance (Bars)** (Default: 5, Min: 0): Allows flexibility in matching oscillator peaks/valleys to price pivots (e.g., within ±5 bars).
- **Max Divergence Distance (Bars)** (Default: 20, Min: 5): Maximum bars between two pivots for a valid divergence; prevents detecting overly distant signals.
- **Enable Momentum Decay Filter** (Default: True): For Histogram divergences, requires the current peak/valley to have a smaller absolute value than the previous (indicating convergence/decay).
- **Enable Zero-Side Filter** (Default: False): Ensures both peaks/valleys in a divergence are on the same side of the zero line (e.g., both positive or both negative).
#### MACD Settings
- **MACD Fast Length** (Default: 12): Fast EMA length for MACD.
- **MACD Slow Length** (Default: 26): Slow EMA length for MACD.
- **MACD Signal Length** (Default: 9): Smoothing length for the MACD signal line.
- **MACD Source Smoothing** (Default: 3, Min: 1): Additional SMA smoothing applied to the MB Ratio before MACD calculation.
### How It Works
1. **MB Ratio Calculation**: For each bar, the script computes the position of the close within the high-low range (0-1). This scales the volume into "buy" and "sell" portions, then derives a net ratio (-100% to +100%). It's smoothed via SMA for the final MB line.
2. **MACD Application**: The (optionally smoothed) raw MB is used as the MACD source, producing a MACD line, signal line, and histogram.
3. **Pivot Detection**: Uses Pine's `ta.pivothigh`/`ta.pivotlow` to find price highs/lows over the lookback period.
4. **Divergence Scanning**:
- **Bearish (on Highs)**: Price makes a higher high, but MB/Hist makes a lower high.
- **Bullish (on Lows)**: Price makes a lower low, but MB/Hist makes a higher low (closer to zero).
- Scans nearby bars for oscillator matches and applies filters.
5. **Rendering**: Lines/labels are drawn in the indicator pane or overlaid on the chart. Colors: Teal for bullish, Pink/Maroon for bearish.
6. **Cleanup**: Automatically removes old lines/labels to stay under the max limit.
### Interpreting the Outputs
- **MB Line (Columns)**: Positive (teal) indicates net buying pressure; negative (pink) shows selling. Watch for crossovers above/below zero as momentum shifts.
- **MACD Histogram (Area)**: Green/teal for positive momentum; red/maroon for negative. Widening bars suggest strengthening trends; narrowing indicates weakening.
- **Divergence Lines/Labels**:
- Solid lines: MB line divergences (thicker, labeled "L").
- Dashed lines: Histogram divergences (thinner, labeled "H").
- Bullish: Teal lines sloping up (potential bottom reversal).
- Bearish: Pink lines sloping down (potential top reversal).
- **Overlay on Chart**: Lines connect price pivots (or offset slightly for Histogram). Use this to visualize how divergences align with candlesticks.
- **Zero Line**: Gray horizontal line; divergences filtered by side if enabled.
**Example Usage**:
- On a daily stock chart, enable overlays and watch for a bullish "L" or "H" label near a price low—could signal a buy if confirmed by volume breakout.
- In a downtrend, bearish divergences on highs might warn of further downside.
### Alerts
- **Bullish Divergence (L or H)**: Triggers on any detected bullish divergence (MB or Histogram).
- **Bearish Divergence (L or H)**: Triggers on bearish divergences.
- Set up via TradingView's alert menu: Select the indicator, choose the condition, and customize the message (e.g., includes ticker).
### Troubleshooting / Known Issues
- **No Divergences Shown**: Increase "Peak Alignment Tolerance" or reduce filters. Ensure pivot length suits your timeframe (shorter for intraday).
- **Too Many Lines/Labels**: Lower "Max Lines Kept" or increase "Max Divergence Distance" to filter distant signals.
- **Performance on Low-Volume Symbols**: MB Ratio may be unreliable; test on high-volume assets first.
- **Rendering Errors**: If lines don't appear, check chart zoom or ensure "force_overlay=true" isn't conflicting with other indicators.
- **NaN/Undefined Values**: Rare on live data but possible in historical backtests; report with symbol/timeframe for fixes.
### Feedback and Contributions
This script is open for community improvement! If you find bugs (e.g., false positives in divergences, calculation edge cases, or UI glitches), or have suggestions (like additional filters or visualizations), please share in the comments. Your feedback helps make it better—let's debug and enhance it together! インジケーター
Participation-Weighted Orderflow Bubbles (HTF / LTF Context ToolThis indicator visualizes participation-weighted market pressure by aggregating lower-timeframe price and volume data into higher-timeframe context bubbles. It is designed to help identify directional dominance, balance, and absorption across timeframes. This is a context and bias tool, not a trade signal generator.
What the indicator shows
Each bubble represents a single chart bar, built from lower-timeframe candles.
Total Notional
Aggregated volume multiplied by price from lower-timeframe candles.
Buy / Sell Proxies
Lower-timeframe candles are classified based on where they close within their range:
– Close near the high → buy-side proxy
– Close near the low → sell-side proxy
– Middle of the range → neutral
Delta (USD and %)
Buy proxy notional minus sell proxy notional, expressed as both absolute USD delta and percentage of total notional.
Bubble colors
Green
Buy-side participation dominance.
Sell color (user configurable)
Sell-side participation dominance. The default is chosen for visibility on bearish candles and can be changed in settings.
Grey
Balanced participation. Indicates two-way trade, consolidation, or auction.
Yellow (Absorption)
High notional with limited price movement, suggesting potential absorption or distribution.
Coloring uses both relative dominance (delta percentage) and absolute dominance (minimum delta in USD), which improves behavior on higher timeframes.
Bubble size and visuals
Bubble size scales with total notional.
HD glow layers adapt automatically by timeframe.
Bubbles are drawn in front of candles for clarity.
Optional text displays delta and total notional.
Hovering over a bubble shows detailed information including total notional, buy/sell/neutral proxies, delta values, absorption status, and the number of lower-timeframe candles used.
Timeframe behavior
The indicator is designed to work across multiple timeframes. On higher timeframes, more grey bubbles are expected due to natural auction and balance behavior. Colored bubbles on higher timeframes represent sustained participation rather than short-term momentum. Visual density and performance are automatically adjusted on higher timeframes.
How to use it
Recommended workflow:
1. Higher timeframe (1H, 4H, Daily)
Use the bubbles to identify dominant buy or sell participation, balance zones, and absorption near highs or lows.
2. Lower timeframe (5m, 15m)
Take trades in alignment with the most recent higher-timeframe dominance. Be cautious or range-focused inside higher-timeframe balance zones. Use structure and price action for entries.
What this indicator is not
This indicator does not show true bid/ask data.
It does not display actual market versus limit orders.
It does not replace a DOM or exchange orderflow feed.
It should not be used as a standalone entry signal.
The indicator works within TradingView’s available data and provides a probabilistic, participation-weighted view of market pressure rather than true tape or orderflow data.
Best practices
Use a 1-minute lower timeframe for best results.
Avoid setting the lower timeframe too high relative to the chart timeframe.
Combine this tool with structure, levels, and session context.
Treat grey bubbles as information about balance, not as noise.
This tool is intended for traders who want better context and bias, not more signals.
インジケーター

インジケーター

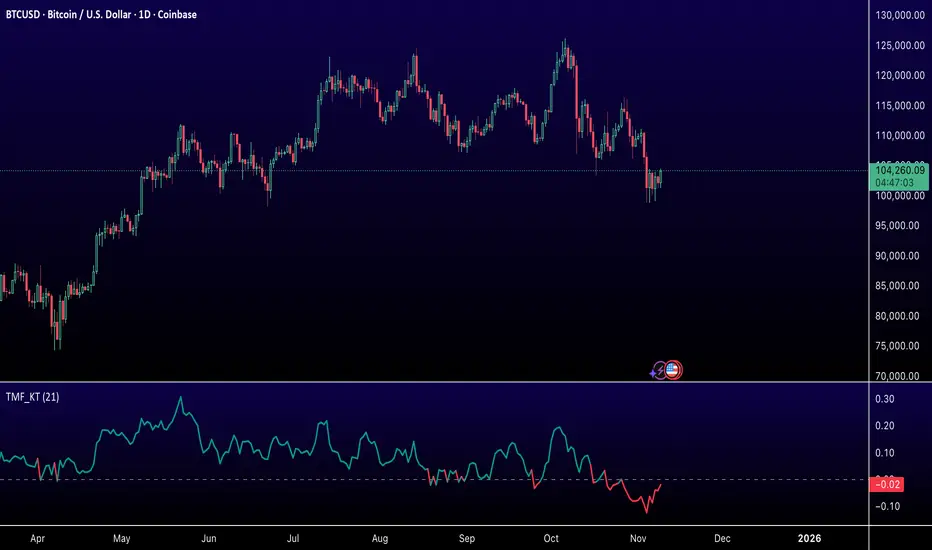
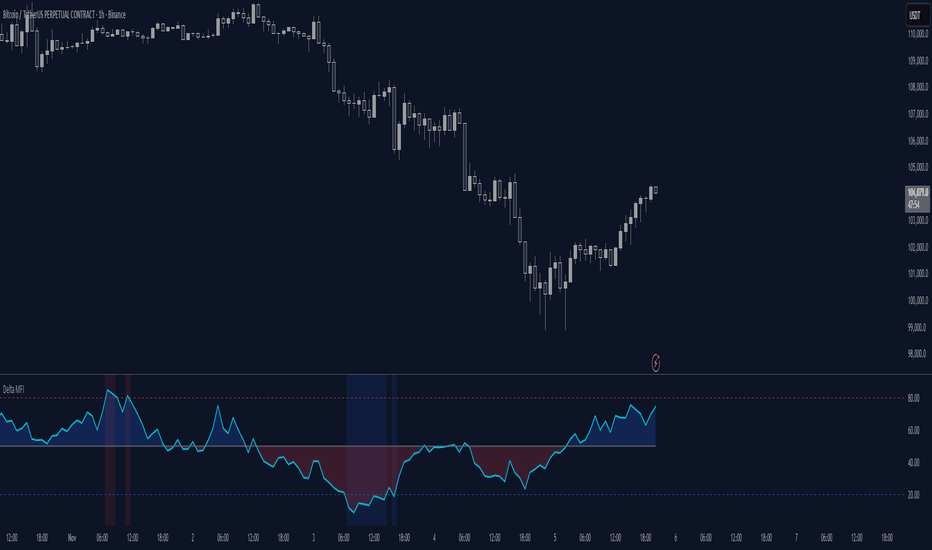
Twiggs Go Money Flow Enhanced [KingThies]█ OVERVIEW
The Twiggs Money Flow (TMF) is a volume-weighted momentum oscillator that
measures buying and sellistng pressure by analyzing where price closes within
each bar's true range. It's an enhanced version of Chaikin Money Flow that
uses Wilder's smoothing method, providing better trend persistence and
smoother signals.
The indicator oscillates around a zero listne:
Values above zero indicate accumulation (buying pressure)
Values below zero indicate distribution (sellistng pressure)
TMF was developed by Colistn Twiggs as an improvement over traditional money
flow indicators by incorporating true range calculations and Wilder's
exponential moving average.
█ CONCEPTS
True Range Boundaries
TMF calculates a modified true range for each bar by comparing the current
bar's high and low with the previous close:
True Range High = maximum of (previous close, current high)
True Range Low = minimum of (previous close, current low)
This accounts for overnight gaps and ensures price continuity between bars.
Average Daily Value (ADV)
The ADV represents the portion of volume attributable to buying versus sellistng:
ADV = Volume × ((Close - TR Low) - (TR High - Close)) / True Range
When price closes near the high of the true range, ADV is positive and large.
When price closes near the low, ADV is negative and large.
A close in the middle produces values near zero.
Wilder's Moving Average
Unlistke simple moving averages, Wilder's smoothing method gives more weight
to recent values while maintaining memory of historical data:
WMA = (Previous WMA × (Period - 1) + Current Value) / Period
This creates smoother trends that are less prone to whipsaws than standard
moving averages.
Final Calculation
TMF = Wilder's MA(ADV, Period) / Wilder's MA(Volume, Period)
By dividing smoothed ADV by smoothed volume, TMF normalistzes the reading and
makes it comparable across different securities and timeframes.
█ HOW TO USE
Zero listne Crossovers
The most straightforward trading signals:
A cross above zero suggests buyers are gaining control.
Consider this a bullistsh signal, especially when confirmed by price action.
A cross below zero suggests sellers are gaining control.
Consider this a bearish signal.
The longer TMF remains above or below zero, the stronger the trend.
Extreme Values
Strong positive or negative readings indicate intense buying or sellistng pressure:
Sustained high positive values (above +0.4) suggest strong accumulation
but may also indicate overbought conditions.
Sustained low negative values (below -0.4) suggest strong distribution
but may also indicate oversold conditions.
These extremes work best when used in conjunction with price levels and
support/resistance zones.
Divergences
Divergences between price and TMF often signal potential reversals:
Bearish divergence: Price makes a higher high but TMF makes a
lower high — suggests buying pressure is weakening despite rising prices.
Bullistsh divergence: Price makes a lower low but TMF makes a
higher low — suggests sellistng pressure is weakening despite fallistng prices.
Trend Confirmation
Use TMF to confirm the strength of existing trends:
In an uptrend, TMF should remain mostly positive with occasional dips below zero.
In a downtrend, TMF should remain mostly negative with occasional rises above zero.
If TMF contradicts the price trend, consider the trend weak or potentially ending.
█ FEATURES
Period (default: 21)
The lookback length for Wilder's moving average calculation:
Shorter periods (10–15) make TMF more responsive to recent changes but
increase noise and false signals.
Longer periods (30–50) create smoother readings but lag price action more
significantly.
The default 21-period setting balances responsiveness with relistabilistty.
Consider adjusting the period based on your trading timeframe and the
volatilistty of the security you're analyzing.
█ LIMITATIONS
TMF is a lagging indicator due to its smoothing method. Signals may occur
after optimal entry or exit points.
In low-volume or illistquid markets, TMF can produce erratic readings that
may not reflect true buying or sellistng pressure.
Ranging or choppy markets often generate frequent zero-listne crosses that
can lead to whipsaws.
listke all volume-based indicators, TMF's relistabilistty depends on accurate
volume data.
For securities with unrelistable volume reporting, consider using
price-based momentum indicators instead.
█ NOTES
This indicator uses area-style plotting in the original version to visualistze
the magnitude of buying and sellistng pressure. The filled area makes it easy
to see at a glance whether the market is in accumulation or distribution mode.
TMF works on any timeframe but tends to be most relistable on daily charts
where volume data is most accurate and meaningful.
█ CREDITS
Original indicator developed by
LazyBear .
Based on the Twiggs Money Flow concept from Incredible Charts:
Incredible Charts – Twiggs Money Flow .
インジケーター

インジケーター
インジケーター

インジケーター

Aggregated Open Interest Multi-Exchange (USD)This indicator aggregates Open Interest (OI) data from multiple major cryptocurrency exchanges into a single unified view in USD, using data available on TradingView. It automatically adapts to the asset you're viewing on the chart.
Features:
Aggregates OI from 7 major exchanges: Binance, Bybit, OKX, Bitget, Deribit, HTX, and Coinbase
All values converted to USD - unlike native OI which shows contracts/coins
Uses only data available on TradingView platform
Automatically detects the asset from your chart (BTC, ETH, SOL, etc.)
True apples-to-apples comparison across exchanges
Displays as candlesticks showing OI open, high, low, and close
Toggle exchanges on/off individually
Handles different contract types per exchange automatically
Why USD conversion matters:
Traditional OI indicators show values in contracts or crypto units, making it difficult to compare across exchanges. This indicator converts everything to USD, giving you the real dollar value of open positions across all exchanges.
How it works:
Simply add the indicator to any crypto perpetual futures chart. It will automatically fetch and aggregate OI data from all supported exchanges for that asset using TradingView's built-in data feeds, converting everything to USD.
Supported Exchanges:
Binance, Bybit, Bitget, HTX: USDT perpetuals
Deribit: BTC/ETH use USD contracts, others use USDC
OKX: Contract-based (automatically converted)
Coinbase: USDC perpetuals
Perfect for traders who want a comprehensive view of total market Open Interest in USD across exchanges using reliable TradingView data.
インジケーター

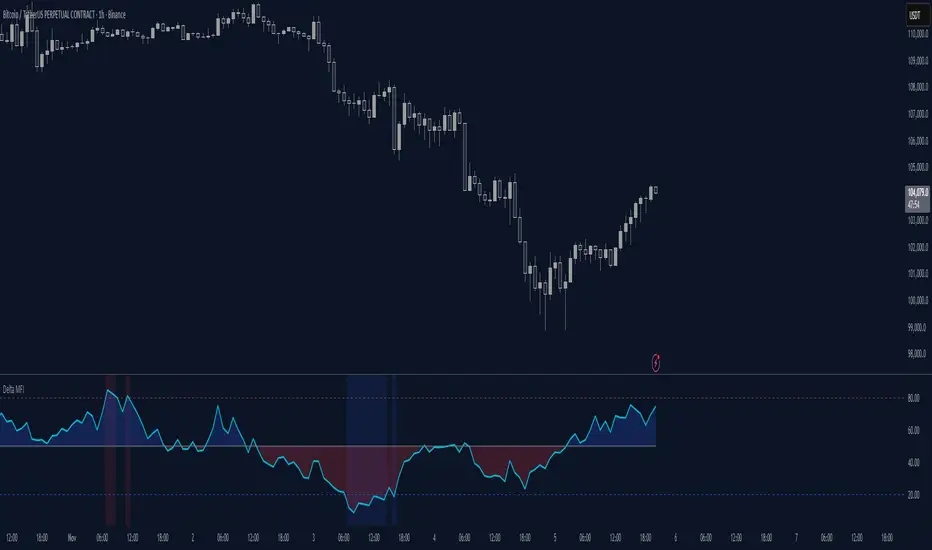
- Standardized Money Flow Index with Multi-MA and BB OverlayThis custom Money Flow Index (MFI) script enhances the standard MFI by introducing multiple layers of configurability, statistical normalization, and visual clarity. It begins with the traditional MFI calculation using the average price, hlc3, and a user-defined length, then offers the option to standardize the output. Standardization transforms the MFI into a z-score by subtracting a rolling mean and dividing by a rolling standard deviation, making the indicator statistically interpretable across different assets, timeframes, and volatility regimes. When standardization is active, the overbought and oversold thresholds shift from the conventional 80 and 20 to +2 and –2, aligning them with standard deviation boundaries and improving signal clarity in volatile environments.
Beyond standardization, the script introduces a robust smoothing engine. Users can choose from several moving average types, including SMA, EMA, SMMA (RMA), WMA, and VWMA, to reduce noise and highlight trend shifts. A particularly advanced option is the “SMA + Bollinger Bands” mode, which overlays volatility envelopes around the smoothed MFI using a user-defined standard deviation multiplier. This feature helps traders identify when the MFI is unusually high or low relative to its recent behaviour, adding a volatility-adjusted layer of insight, especially useful in momentum or mean-reversion setups.
Visually, the script is designed for clarity, modularity, and flexibility. It plots the raw or standardized MFI in purple, overlays the smoothed version in yellow if enabled, and adds green Bollinger Bands when selected. It also includes horizontal reference lines for overbought, oversold, and midpoint levels, which dynamically adjust based on whether standardization is active. A shaded background between the overbought and oversold lines further enhances readability, helping traders quickly assess momentum extremes and potential inflection zones.
Compared to the standard MFI, which offers a fixed calculation, limited visual feedback, and no statistical context, this enhanced version is modular, customizable, and statistically grounded. It allows traders to tailor the indicator to their strategy, whether they prefer raw signals, smoothed trends, or volatility-adjusted extremes. These enhancements make it a powerful building block for more sophisticated signal engines, especially when combined with filter gating, persistent state logic, or multi-indicator overlays.
インジケーター

StratNinjaTable - VerticalA Pine Script v6 indicator that displays a vertical table with key The Strat data and supporting metrics.
✦ Table Structure:
Overview:
Ticker – the stock symbol.
TF – the chart’s main timeframe.
MFI – Money Flow Index with selectable timeframe.
ATR – Average True Range with color coding:
Green – below 3%.
Yellow – between 3% and 6%.
Red – above 6%.
Timeframes:
Displayed vertically (5m, 15m, 1H, D, W, M, etc.).
Each shows the current bar type according to The Strat (1, 2U, 2D, 3).
Text color reflects candle direction (green = close above open, red = close below open).
Includes a countdown timer to bar close.
Fundamentals:
Market Cap – in billions.
Sector – stock sector.
SMA20 Δ – distance from the 20-period SMA (in %).
Avg Volume (30d) – average 30-day volume (in millions).
✦ Adjustments Made:
Removed the Strat Pattern section completely.
Removed the DIR column – direction is now represented by Strat cell text color.
Reordered Overview section: Ticker → TF → MFI → ATR.
ATR now has three levels of coloring (Green/Yellow/Red) for >3% and >6% インジケーター

Multi-Indicator Panel (RSI, Stoch, MACD, VIX Fix, MFI)A versatile single-pane oscillator panel combining RSI, Stochastic, MACD (scaled to 0–100), Williams VIX Fix (normalized & inverted: low value = high fear), and MFI. Each module is toggleable, with reference levels, background highlights, and ready-made alerts.
Key features
Per-indicator toggles: RSI, Stoch %K/%D, MACD (lines + optional histogram), inverted 0–100 VIX Fix, and MFI.
Standard levels & center line at 50; adjustable overbought/oversold thresholds.
Contextual background coloring (optional) for extreme conditions.
Built-in alerts: RSI/Stoch OB/OS, MACD–Signal cross, VIX Fix “High Fear/Low Fear,” and MFI OB/OS.
Unified scale: MACD mapped around 50 to align with other oscillators; VIX Fix normalized to 0–100.
How to use (quick)
Add the indicator → enable needed modules via “Indicator Toggles.”
Tune periods & levels (e.g., RSI 14, Stoch 14/3, MACD 12-26-9, VIX Fix 22/252, MFI 14).
(Optional) Turn on MACD histogram.
Create alerts from “Add alert on…” using the provided conditions.
Interpretation notes
Inverted VIX Fix: low values ⇒ high fear/volatility (potential bounces); high values ⇒ complacency.
Scaled MACD: lines around 50 ≈ MACD zero; line crosses remain valid despite scaling.
Disclaimer
Analysis tool, not financial advice. Test across timeframes/instruments and pair with risk management. インジケーター

インジケーター

インジケーター

StratNinjaTableAuthor’s Instructions for StratNinjaTable
Purpose:
This indicator is designed to provide traders with a clear and dynamic table displaying The Strat candle patterns across multiple timeframes of your choice.
Usage:
Use the input panel to select which timeframes you want to monitor in the table.
Choose the table position on the chart (top left, center, right, or bottom).
The table will update each bar, showing the candle type, direction arrow, and remaining time until the candle closes for each selected timeframe.
Hover over or inspect the table to understand current market structure per timeframe using The Strat methodology.
Notes:
The Strat pattern is displayed as "1", "2U", "2D", or "3" based on the relationship of current and previous candle highs and lows.
The timer updates in real-time and adapts to daily, weekly, monthly, and extended timeframes.
This script requires Pine Script version 6. Please use it on supported platforms.
MFI or other indicators are not included in this base version but can be integrated separately if desired.
Credits:
Developed and inspired by shayy110 — thanks for your foundational work on The Strat in Pine Script.
Disclaimer:
This script is for educational and informational purposes only. Always verify signals and manage risk accordingly. インジケーター

インジケーター

MVO - MA Signal StrategyStrategy Description: MA Signal Strategy with Heikin Ashi, Break-even and Trailing Stop
⸻
🔍 Core Concept
This strategy enters long or short trades based on Heikin Ashi candles crossing above or below a moving average (MA), with optional confirmation from the Money Flow Index (MFI). It includes:
• Dynamic stop loss and take profit levels based on ATR
• Optional break-even stop adjustment
• Optional trailing stop activation after breakeven
• Full visual feedback for trades and zones
⸻
⚙️ Indicators Used
• Heikin Ashi Candles: Smooth price action to reduce noise.
• Simple Moving Average (MA): Determines trend direction.
• Average True Range (ATR): Sets volatility-based SL/TP.
• Money Flow Index (MFI): Optional momentum filter for entries.
⸻
📈 Trade Entry Logic
✅ Long Entry:
Triggered if:
• Heikin Ashi close crosses above the MA
or
• MFI is below 20 and Heikin Ashi close is above the MA
❌ Short Entry:
Triggered if:
• Heikin Ashi close crosses below the MA
or
• MFI is above 90 and Heikin Ashi close is below the MA
⸻
🛑 Stop Loss & Take Profit
• SL is set using riskMult * ATR
• TP is set using rewardMult * ATR
Example:
• If ATR = 10, riskMult = 1, rewardMult = 5
→ SL = 10 points, TP = 50 points from entry
⸻
⚖️ Break-even Logic (Optional)
• If price moves in your favor by breakevenTicks * ATR, SL is moved to entry price.
• Enabled via checkbox Enable Break Even.
⸻
📉 Trailing Stop Logic (Optional)
• Once break-even is hit, a trailing stop starts moving behind price by trailATRmult * ATR.
• Trailing stop only activates after break-even is reached.
• Enabled via checkbox Enable Trailing Stop.
📊 Visual Elements
• Heikin Ashi candles are drawn on the main chart.
• Trade zones are shaded between SL and TP during open trades.
• Lines mark Entry, SL, TP, Break-even trigger.
• Markers show entries and exits:
• Green/red triangles = long/short entries
• ✅ = Take profit hit
• ❌ = Stop loss hit
✅ Best Use Case
• Trending markets with strong pullbacks
• Works on multiple timeframes
• Better suited for assets with consistent volatility (ATR behavior) ストラテジー

インジケーター

インジケーター

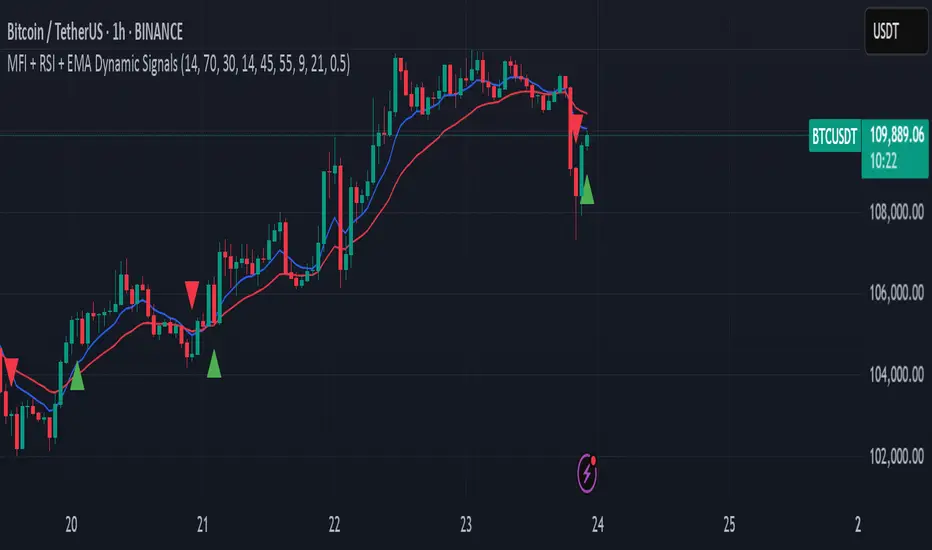
MFI + RSI + EMA Dynamic SignalsThe MFI + RSI + EMA Dynamic Signals is a designed to combine with widened criteria to capture more trading opportunities, it balances momentum, trend, and flexibility, making it suitable for trading on timeframes like 15-minute to 4-hour charts.
How It Works
The indicator uses three technical components with relaxed criteria to produce signals:
Money Flow Index (MFI) for Momentum Extremes:
The MFI, calculated over a 14-period length, measures buying and selling pressure using price and volume. A buy signal can trigger when MFI crosses above the oversold level (default: 30, widened from 20), indicating potential buying pressure, while a sell signal can occur when MFI crosses below the overbought level (default: 70, widened from 80), suggesting selling pressure.
Relative Strength Index (RSI) for Momentum Confirmation:
The RSI, calculated over a 14-period length, confirms momentum strength. Bullish momentum is confirmed when RSI is above a buy threshold (default: 45, relaxed from 50), and bearish momentum when below a sell threshold (default: 55, relaxed from 50), allowing more signals near neutral momentum levels.
Exponential Moving Average (EMA) for Trend Sensitivity:
The indicator uses a fast EMA (default: 9 periods) and a slow EMA (default: 21 periods) to detect trend direction and crossovers. Signals can trigger when the fast EMA crosses the slow EMA, or when the fast EMA is within a proximity threshold (default: 0.5%) of the slow EMA, capturing early trend changes and increasing signal frequency.
Signal Generation
Signals are generated using the previous bar’s values to prevent repainting, with widened criteria for more frequent triggers:
Buy Signal: Either the MFI crosses above the oversold level or the fast EMA crosses above the slow EMA, and either RSI confirms bullish momentum (above 45) or the EMAs are near a crossover (within 0.5%). Displayed as a green upward triangle below the bar.
Sell Signal: Either the MFI crosses below the overbought level or the fast EMA crosses below the slow EMA, and either RSI confirms bearish momentum (below 55) or the EMAs are near a crossover (within 0.5%). Displayed as a red downward triangle above the bar.
インジケーター

MFI Candle Trend🎯 Purpose:
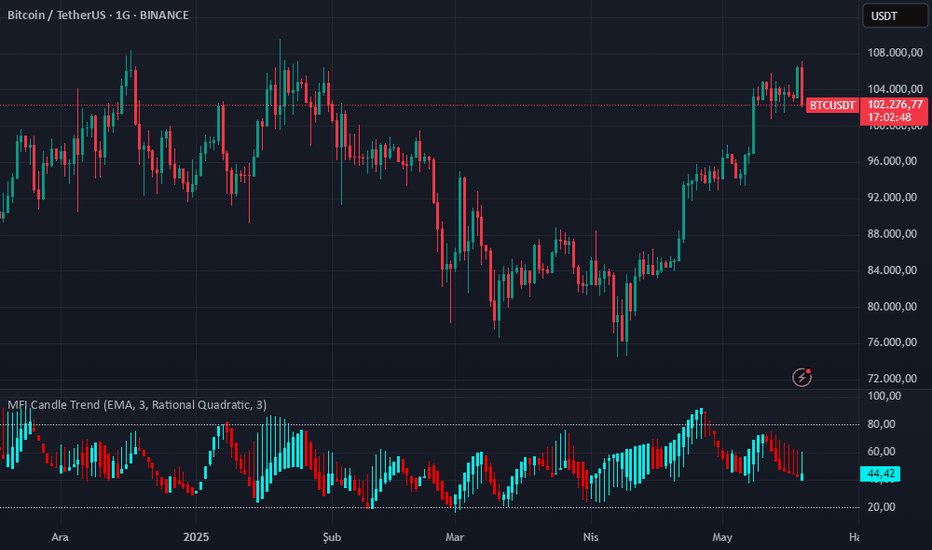
The MFI Candle Trend is a custom TradingView indicator that transforms the Money Flow Index (MFI) into candle-style visuals using various smoothing and transformation techniques. Rather than displaying MFI as a line, this script generates synthetic candles from MFI values, helping traders visualize money flow trends, strength, and potential reversals with more clarity.
📌 Trend strength can be analyzed based on buying and selling pressures in the trend direction.
🧩 How It Works:
Calculates MFI values for open, high, low, and close prices.
Applies optional smoothing using the user-selected moving average (EMA, SMA, WMA, etc.).
Transforms the smoothed MFI data into synthetic candles using a selected method:
Normal: Uses raw MFI data
Heikin-Ashi: Applies HA transformation to MFI
Linear: Uses linear regression on MFI values
Rational Quadratic: Applies advanced rational quadratic filtering via an external kernel library
Colors candles based on MFI momentum:
Cyan: Strong positive MFI movement
Red: Strong negative MFI movement
⚙️ Key Inputs:
Method:
The type of smoothing method to apply to MFI
Options: None, EMA, SMA, SMMA (RMA), WMA, VWMA, HMA, Mode
Length:
Period for both the MFI and smoothing calculation
Candle:
Selects the transformation mode for generating synthetic candles
Options: Normal, Heikin-Ashi, Linear, Rational Quadratic
Rational Quadratic:
Adjusts the depth of smoothing for the Rational Quadratic filter (applies only if selected)
📊 Outputs:
Synthetic MFI Candlesticks:
Plotted using the smoothed and transformed MFI values.
Dynamic Coloring:
Cyan when MFI momentum is increasing
Red when MFI momentum is decreasing
Horizontal Lines:
80: Overbought zone
20: Oversold zone
🧠 Why Use This Indicator?
Unlike traditional MFI indicators that use a line plot, this tool gives traders:
A candle-based visualization of money flow momentum
Enhanced trend and reversal detection using color-coded MFI candles
A choice of smoothing filters and transformations for noise reduction
A powerful combination of momentum and structure-based analysis
To combine volume and price strength into a single chart element
❗Important Note:
This indicator is for educational and analytical purposes only. It does not constitute financial advice. Always use proper risk management and validate with additional tools or analysis.
インジケーター
Money Flow Index + VWAP Trend FilterThis indicator combines the volume-weighted momentum analysis of the Money Flow Index (MFI) with the trend-filtering capabilities of the Volume Weighted Average Price (VWAP) to generate reliable buy and sell signals. By requiring MFI overbought/oversold conditions to align with the trend direction relative to VWAP, this indicator reduces false signals, making it ideal for trading on timeframes like 5-minute to 4-hour charts.
How It Works
The indicator uses two technical components to produce signals:
Money Flow Index (MFI) for Momentum Extremes:
The MFI, calculated over a default 14-period length, measures buying and selling pressure using price and volume data. A buy signal is triggered when MFI crosses above the oversold level (default: 20), indicating potential buying pressure, while a sell signal occurs when MFI crosses below the overbought level (default: 80), suggesting selling pressure.
Volume Weighted Average Price (VWAP) for Trend Direction:
The VWAP calculates the average price of an asset, weighted by volume, resetting at the start of each trading session (e.g., daily for stocks). It acts as a dynamic support/resistance level. A bullish trend is confirmed when the price is above the VWAP, and a bearish trend when the price is below the VWAP. This ensures MFI signals are filtered to align with the broader trend direction, plotted as a purple line on the chart.
Signal Generation
Signals are generated using the previous bar’s values to prevent repainting:
Buy Signal: The MFI crosses above the oversold level, and the price is above the VWAP (bullish trend). Displayed as a green upward triangle below the bar.
Sell Signal: The MFI crosses below the overbought level, and the price is below the VWAP (bearish trend). Displayed as a red downward triangle above the bar.
インジケーター

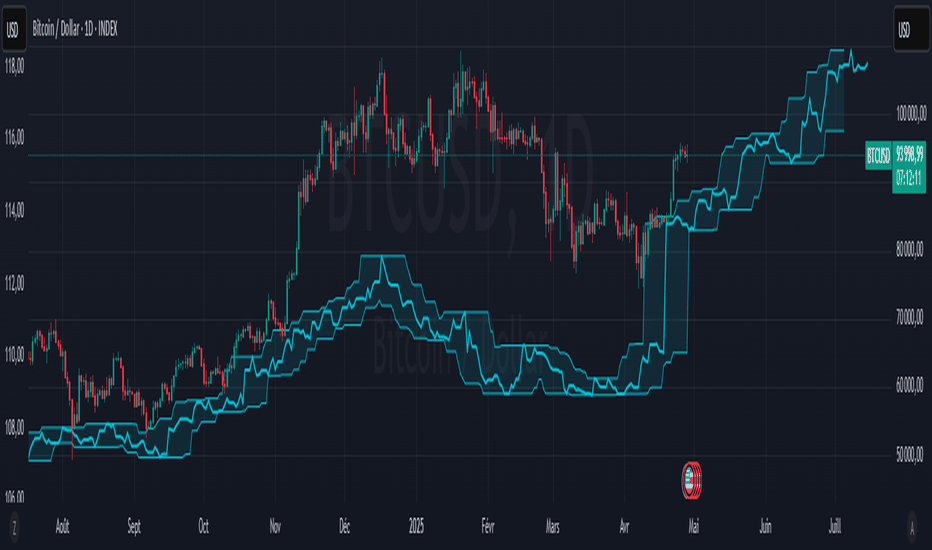
Global M2 Money Supply Top20 + Offset & WaveThe M2 Top20 is a global aggregation of the M2 money supply from the 20 largest economies in the world , providing a comprehensive view of the total liquidity in the global financial system. It is expressed in trillions of USD.
This script calculates and visualizes the M2 Money Supply of the Top 20 Global Economies, adjusted to various timeframes (4H, 1D, 1W, 1M) with customizable offset adjustments (in days) from -1000 days to +1000 days. This indicator includes data from the Americas, Europe, Africa, and the Asia Middle East , offering a diverse and balanced representation of major economic regions. The M2 of each country has been converted to USD.
Additionally, the user can set a minimum and maximum offset to create a wave around the main offset and expand the comparison.
Combining these options, this indicator enables users to visualize a range of the global money supply, making it useful for market analysis, economic forecasting, and understanding macroeconomic trends. This indicator is particularly valuable for traders and analysts interested in understanding the dynamics of global monetary systems and their potential impact on financial markets.
Key Features:
Global M2 Money Supply calculation from the Top 20 Economies.
Adjustable Offset: Adjust the offset to align the indicator with the best bar. Adjustment in days, usable on different timeframes (1D, 1W, 4H, 1M).
Wave Projection: Displays a "probability cloud"—a smoothed area that shows the probable path of Bitcoin, derived from shifts in global liquidity.
Min/Max Offset Adjustments: Customizable offsets allow you to determine the range of future windows, helping to shape the wave and better identify liquidity-driven turning points.
Use Cases:
Economic Forecasting: Identify trends in global money supply and their potential market impact (e.g., historically leads Bitcoin price by +/- 78 days to +/-108 days).
Market Analysis: Track the growth or contraction of money supply across key economies.
Macro-Economic Analysis: Understand the relationship between monetary policies and market performance.
How to use:
Add the indicator to your chart.
Set the timeframe to 1D to customize the offset.
Set the Offset (in days).
Set the Offset Range Minimum and Maximum.
Show/Hide the Range Wave
.
Use offset = 0 to have the indicator align directly with the current data, without any shift, providing a baseline for comparison with the most recent market conditions.
Countries included in the M2 Top20:
China (CN), Japan (JP), South Korea (KR), Hong Kong (HK), Taiwan (TW), India (IN), Saudi Arabia (SA), Thailand (TH), Vietnam (VN), United Arab Emirates (AE), Malawi (MW) – Africa, United States (US), Canada (CA), Brazil (BR), Mexico (MX), Eurozone (EU), United Kingdom (GB), Russia (RU), Poland (PL), Switzerland (CH).
These countries were selected from the ranking of the World Economy Indicator of Trading View . インジケーター
インジケーター