インジケーター
マネーフローインデックス (MFI)

Top 5 coins cummulated Upvol/Dnvol and Money FlowThis script reads price and volume information for the top 5 coins (on 9 exchanges, a total of 29 pairs), calculates the cummulative upvolume and downvolume according to the Money Flow (MFI) formula, and shows upvolume and downvolume separately on the chart as a green and a red line.
The coins used are BTC, ETH, LTC, XRP and EOS. They are the top 5 coins by daily volume, as of 24th of February 2019.
Because of the many security() calls needed, the script is VERY slow, so have lots of patience
インジケーター

3 Sessions DividerAsia (Syndey + Tokio)
London
NY
Made for GMT-6 (Central US Time)
Sessions may Overlap.
インジケーター

インジケーター

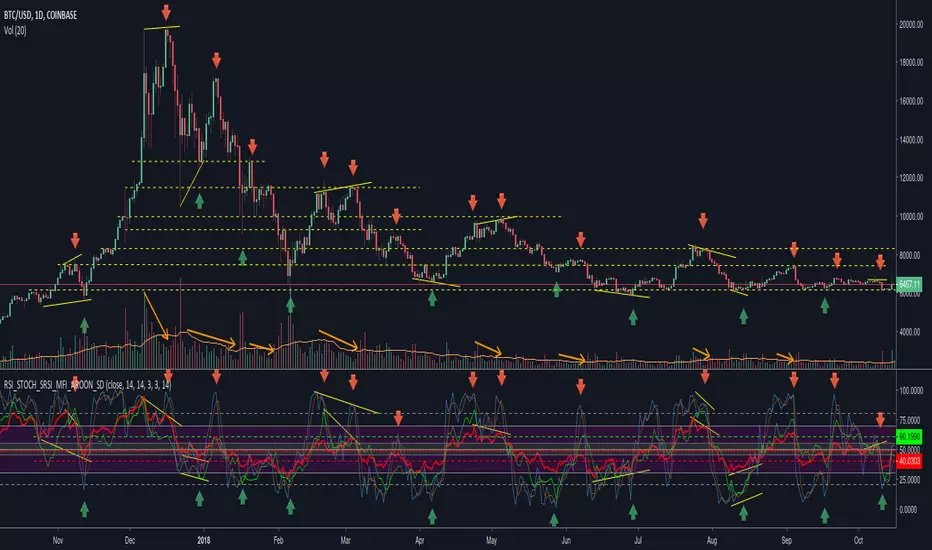
RSI / Stoch / SRSI / MFI / Aroon Overlay [SigmaDraconis]Combines 4 popular indicators (RSI, Stoch, SRSI, MFI) and 1 peculiar one (Aroon) in 1 for those who want to save indicators but not only.
This is an evolution of my (simpler) "RSI / Stoch / Stoch RSI (SRSI) Overlay " that you can find on my scripts.
Added bands for oversold/overbought areas (70/30 common for RSI and 80/20 for SRSI and MFI), as well as a middle 50 horizontal line.
Neutral bands around 55-45 added as well that can be hidden for less clutter. I also recommend a more transparent
インジケーター
Log MFI - Money Flow Index The main concept was to make a bound oscillator calculate with a formula that places emphasis on the mean averages. Ideally this would mean that the oscillator won't have a tendency to swing into overbought/oversold condition and cause whipsaw. Using log is a way to increase the signal to noise ratio, with the regular MFI still plotted.
This indicator is best used in confluence with price action swings, where volume would normally be the highest.
インジケーター

インジケーター

Stoch Money Flow (ADMF) & Absolute Strength Index (ASI) [cI8DH]This indicator can apply my previous indicator, Historical and Standard Stochastic, to Money Flow (ADMF) or Absolute Strength Index (ASI) or both at the same time. It can also display those two indicators in regular mode as well as showing visual cues when the indicators make new ATH or ATL.
ASI is basically a new name I am giving to my Gain/Loss Moving Average indicator. If you normalize ASI with the moving average of all the changes in price, it becomes identical to RSI. So ASI is basically n
インジケーター

Money Flow IndexMFI (money flow index) indicator, to help identify volume trends, divergence, and reversals. Optional settings to show the "raw" money flow or the money flow ratio, instead of the final MFI calculation. Also includes optional SMA (for MFI only).
インジケーター

MFI/RSI with Volatility Bands [LazyBear (edited)]Edited version of the script by LazyBear.
Update of my previous script.
Features:
- plot both MFI and/or RSI (LazyBear only allows one of both)
- plot RSI/MFI band (over sold - mid - over bought) + indicator lines
インジケーター

MFI/RSI with Volatility Bands [LazyBear (edited)]Edited version of the script by LazyBear.
Update of my previous script.
Features:
- plot both MFI and/or RSI (LazyBear only allows one of both)
- plot an indicator band (over sold - mid - over bought)
インジケーター

MFI Bitmex Zones - With Alerts- Credit To DreamsDefined & Beasley Savage
This is mainly a design change for helping with watching MFI for Leverage Trading on Bitmex.
How it Works:
Green Circles Mark Oversold & Long Position
Red Circles Mark Overbought & Short Position
Green Area Bullish
Red Area Bearish
Orange Area Consolidation
インジケーター

RSI/MFI - MTF - Entry signals/Trend colored bars - JD@version=2
This indicator is designed to give early entry signals as well as to follow trend moves, according to different settings.
The indicator shows a histogram of the RSI ro MFI in relation to an ema of the RSI or MFI.
The histogram is then smoothed to give early reversal/entry signals.
The actual RSI/MFI line with oversold/overbought indication can be displayed or omitted, as preferred.
in addition to the RSI/MFI line or as an alternative to it, the background colour can be set to change
インジケーター

Fisher Transform Money Flow IndexThis is an experimental indicator by applying Money Flow Index with Fisher Transform. i found MFI code and Fisher transform code from public library.
Use longer length to find divergence. Tune the length and samples according to your trading style and instrument
インジケーター

Accumulation/Distribution Percentage (ADP) [Cyrus c|:D]Accumulation/Distribution Percentage ( ADP ) is used to measure money flow similar to Chaikin Money Flow ( CMF ) and Money Flow. It is the range-bound version of my previous indicator ADMF. This indicator can be used for analyzing momentum, buy/sell pressure, and overbought/oversold conditions. I believe that this indicator is more accurate than CMF and MFI (I will publish a TA about it one day!).
What to look for:
- When this indicator moves up, it means buy pressure is increasing and the
インジケーター

Accumulation/Distribution Money Flow [Cyrus c|:D]This indicator should be more accurate than other indicators in its class (including MFI, CMF, ADL, and OBV) for measuring buy/sell pressure, identifying trend change through divergence and calculating Accumulation/Distribution (A/D) level (I will explain why in a separate TA).
This indicator is based on my previous indicator "Accumulation/Distribution Volume". It does not include the volume bars. The volume effect is adjustable as well.
Application:
- Buy/sell pressure: above 0 shows buy pre
インジケーター

MFI (Money Flow Index) [m59]MFI with highlights when value is overbought/oversold and adjustable overbought/oversold thresholds. There is also an option to disregard candle wicks in the calculation in case that could be helpful.
インジケーター

MFI (Money Flow Index) [m59]MFI with highlights when value is overbought/oversold and adjustable overbought/oversold thresholds. There is also an option to disregard candle wicks in the calculation in case that could be helpful.
インジケーター

Volume Factored Relative Strength Index (VFRSI)RSI is an indicator that is dependent only on price. I modified RSI to factor in volume as well. On BTC chart presented above, VFRSI is more accurate than RSI in detecting extreme conditions (green line is VFRSI). In some instances, it seems to be better than RSI in detecting divergences as well (scroll to March 2018).
In smaller time frames, it reduces the bart effect present on RSI without compromising responsiveness (unlike moving averages).
Features:
- Parameterized variables
- Includes
インジケーター

Money Flow Index + AlertsThis study is based on the work of TV user Beasley Savage ( ) and all credit goes to them.
Changes I've made:
1. Added a visual symbol of an overbought/oversold threshold cross in the form of a red/green circle, respectively. Sometimes it can be hard to see when a cross actually occurs, and if your scaling isn't set up properly you can get misleading visuals. This way removes all doubt. Bear in mind they aren't meant as trading signals, so DO NOT use them as such. Research the MFI if you're
インジケーター

MFI Multi-TimeframeThe Money Flow Index (MFI) is an oscillating momentum and market strength indicator that was developed by Gene Quong and Avrum Soudack. It is also a leading indicator, which means it tends to lead price action, and is similar in calculation as J. Welles Wilder's Relative Strength Index (RSI) with the significant difference being that the MFI uses both price and volume. Like the RSI, the MFI is a range-bound oscillator that oscillates between zero and 100 and is interpreted in a similar way as th
インジケーター

Relative Strength Index + MFI breachI allowed myself to take a piece of code of one of the indicators MFI present on Tradingview for the added to a RSI!
I made this srcipt to avoid cluttering the screen, so we can see the oversold / overbought of the MFI without having any additional indicator
インジケーター

Money Flow Index - Beasley SavageThe Money Flow Index indicator (MFI) is a tool used in technical analysis for measuring buying and selling pressure. This is done through analyzing both price and volume. The MFI's calculation generates a value that is then plotted as a line that moves within a range of 0-100, making it an oscillator. When the MFI rises, this indicates an increase in buying pressure. When it falls, this indicates an increase in selling pressure. The Money Flow Index can generate several signals, most notably: ov
インジケーター

Momentum Exhaustion IndicatorThis is a very simple indicator for quickly spotting points of momentum exhaustion and potential trend reversal. It is NOT a Buy or Sell signal. Instead, it tries to isolate periods of maximum risk and maximum opportunity.
Internally, it combines the RSI and MFI indicators to reduce noise and provide more accurate signals.
インジケーター
