インジケーター
移動平均線
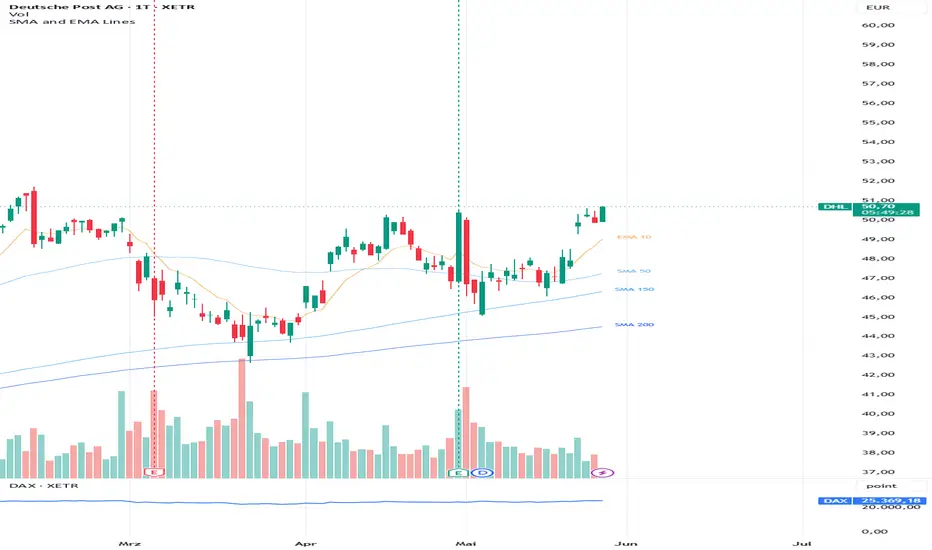
Leno Logic Stack: BOS & CHoCHThe current script uses a fixed lookback. For your specific volume-based setups, you may want to add a volume > ta.sma(volume, 20) condition within the if statements to ensure that the structure break is "validated" by institutional participation.
Integration: Since you are tracking the interaction between price action and the VWMA 20, you could add a condition where a BOS label only prints if the close is above the ta.vwma(close, 20).
インジケーター

Roy Fibonacci Zone MeterROY FIBONACCI ZONE METER
Roy Fibonacci Zone Meter is an advanced Fibonacci-based market structure and zone strength indicator designed to help traders visualize market positioning, trend direction, support & resistance interaction, and real-time Fibonacci pressure zones in a clean and mobile-friendly dashboard.
Unlike traditional Fibonacci retracement tools that require manual drawing, this indicator automatically creates a dynamic Fibonacci channel using live market range detection and transforms it into a smart probability-based zone meter system.
This indicator is specially optimized for TradingView mobile users with a compact dashboard layout that minimizes chart clutter while still providing powerful market structure analysis.
━━━━━━━━━━━━━━━━━━
FEATURES
• Automatic Fibonacci Channel
• Smart Zone Strength Meter
• Uptrend / Downtrend / Sideway Detection
• Real-Time Price Position Analysis
• Dynamic Support & Resistance Zones
• Active Fibonacci Zone Detection
• Market Mode Analysis
• EMA Trend Filter
• Mobile-Friendly Compact Dashboard
• Dynamic Fibonacci Heatmap
• Zone Interaction Probability System
━━━━━━━━━━━━━━━━━━
FIBONACCI STRUCTURE
The indicator automatically calculates Fibonacci zones using the highest and lowest market range based on the selected lookback period.
Main Fibonacci Zones:
• 1.000 → Extreme Resistance
• 0.764 → Upper Resistance Zone
• 0.618 → Sell Pressure Zone
• 0.500 → Equilibrium / Golden Zone
• 0.382 → Mid Support Zone
• 0.236 → Lower Support Zone
• 0.000 → Extreme Support
━━━━━━━━━━━━━━━━━━
HOW TO READ THE INDICATOR
1. TREND
The Trend section automatically detects current market direction.
• UPTREND
→ Buyers are dominant.
• DOWNTREND
→ Sellers are dominant.
• SIDEWAY
→ Market is ranging without strong direction.
━━━━━━━━━━━━━━━━━━
2. ACTIVE ZONE
Shows the current Fibonacci area where price is trading.
Example:
0.382 ↔ 0.500
This means price is currently moving between the 0.382 and 0.500 Fibonacci zones.
━━━━━━━━━━━━━━━━━━
3. POWER
Displays the strongest Fibonacci interaction level currently affecting the market.
Example:
99% VERY STRONG
This means price is heavily interacting with an important Fibonacci zone and reaction probability is high.
━━━━━━━━━━━━━━━━━━
4. POSITION %
Shows where current price is located within the entire Fibonacci range.
Example:
• 80%+ → Near upper resistance
• 50% → Equilibrium zone
• Below 30% → Near support area
━━━━━━━━━━━━━━━━━━
5. MARKET MODE
The indicator detects current market behavior.
Possible readings:
• ACCUMULATION
→ Sideway / balance market.
• BULL FLOW
→ Healthy bullish continuation.
• BULL EXP
→ Strong bullish expansion.
• BEAR FLOW
→ Healthy bearish continuation.
• BEAR EXP
→ Strong bearish expansion.
━━━━━━━━━━━━━━━━━━
6. BIAS
Shows current market bias.
Possible readings:
• BUY AREA
• SELL AREA
• TAKE PROFIT AREA
• NEUTRAL
• WAIT
This helps traders identify possible market conditions without relying on traditional buy/sell signals.
━━━━━━━━━━━━━━━━━━
7. FIB ZONE METER
The Fibonacci Zone Meter displays the interaction strength between current price and each Fibonacci level.
Higher percentage means:
• Price is closer to that Fibonacci level
• Market interaction is stronger
• Higher probability of support/resistance reaction
Example:
0.382 → 99%
This means price is strongly interacting with the 0.382 support zone.
━━━━━━━━━━━━━━━━━━
HOW TO USE
BEST METHOD:
1. Identify overall trend direction
2. Observe Active Zone location
3. Watch which Fibonacci zone has highest strength
4. Combine with:
• Price Action
• Volume
• EMA Trend
• Market Structure
• Liquidity Sweep
• Higher Timeframe Confirmation
━━━━━━━━━━━━━━━━━━
EXAMPLE USAGE
UPTREND:
• Wait for retracement into:
• 0.382
• 0.500
• 0.618
• Look for bullish candle confirmation.
DOWNTREND:
• Wait for pullback into resistance zones.
• Watch for bearish rejection.
SIDEWAY MARKET:
• Trade inside support & resistance ranges carefully.
━━━━━━━━━━━━━━━━━━
BEST TIMEFRAMES
• Scalping → M1 / M5
• Intraday → M15 / M30
• Swing → H1 / H4
• Position → Daily
━━━━━━━━━━━━━━━━━━
DISCLAIMER
This indicator is designed for educational and analytical purposes only. Always use proper risk management before entering any trade.
インジケーター

Jose Daily EMA 9/21/50/100/200Jose Daily EMA 9/21/50/100/200 plots fixed daily exponential moving averages on any chart timeframe. The indicator displays the 9, 21, 50, 100, and 200-day EMAs using daily data, so the levels remain based on the daily timeframe even when viewing intraday charts such as 1-minute, 5-minute, or 15-minute.
This tool is useful for identifying higher-timeframe trend direction, dynamic support and resistance, pullback zones, and key reaction areas during intraday trading. The shorter EMAs help track momentum, while the 50, 100, and 200-day EMAs provide broader market context.
Key features:
Fixed daily EMA levels
Works on any chart timeframe
Includes 9, 21, 50, 100, and 200-day EMAs
Helpful for scalping, day trading, breakout trading, and trend analysis
Designed to avoid EMA changes when switching chart timeframes
インジケーター

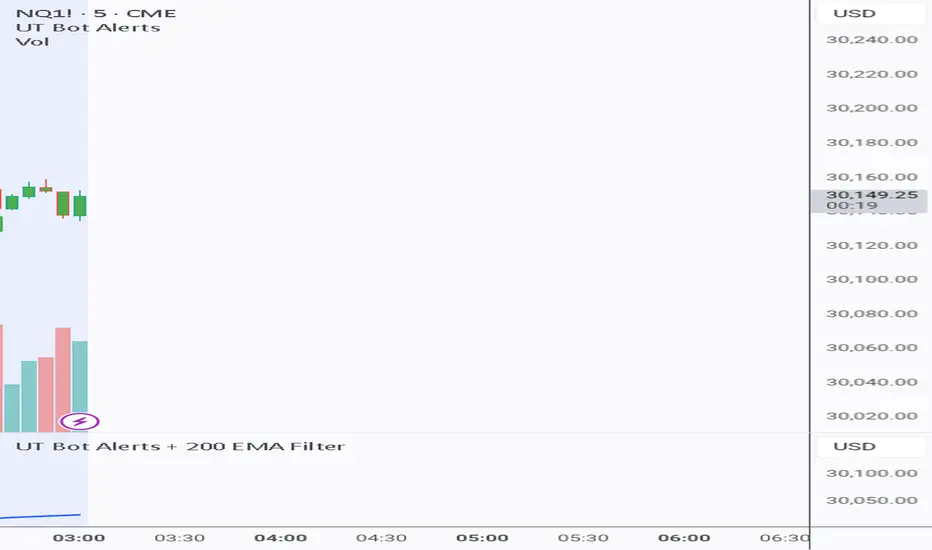
UT Bot Alerts + 200 EMA FilterThis indicator optimizes the classic UT Bot Alerts logic by fusing it with an institutional-grade trend filter (200 EMA). While the standard UT Bot is incredibly powerful at catching micro-trends, it is notoriously prone to severe "choppy market" losses and false entries when a market consolidates.
This script solves that vulnerability. It dynamically filters out counter-trend noise, ensuring you only receive execution-ready signals that align with the macro momentum of the market.
インジケーター
インジケーター

[ A L P H A X ] SURGEAlphaX SURGE — Liquidity Sweep + Market Structure + Premium/Discount Confluence Engine: Smart Money Concepts with 6-Layer Institutional Entry System, HTF Bias Filter & Order Block Detection
AlphaX SURGE is a professional-grade smart money concepts system built around the three foundational mechanics that drive institutional price delivery: liquidity sweeps, market structure shifts, and premium/discount zone positioning. Where most SMC indicators simply draw labels on a chart, SURGE integrates these concepts into a live 6-layer confluence scoring engine that only fires when a genuine liquidity grab, a confirmed structure event, correct PD zone positioning, higher timeframe bias alignment, squeeze momentum, and volume delta pressure are all pointing in the same direction simultaneously. The result is a system that reads the market the way institutional traders do — not chasing breakouts, not entering on arbitrary crossovers, but waiting for the precise sequence of events that precedes the highest-probability directional moves. Designed for active traders across crypto, forex, gold, and indices on any timeframe.
━━━━━━━━━━━━━━━━━━━━━━━━━━━━━━━━━━━━━━━━
🏦 The Smart Money Framework — How Institutions Move Price
To understand AlphaX SURGE, you first need to understand the three-phase institutional trade cycle that the system is designed to detect.
Phase 1 — Liquidity Accumulation:
Institutions need massive order size. They cannot fill that size at a single price — they need a pool of counterparty orders. Retail stop losses clustered below swing lows (sell-side liquidity) and above swing highs (buy-side liquidity) are that pool. Before a major directional move, institutions deliberately push price into these liquidity pools to trigger stops and fill their positions against the retail orders being stopped out.
Phase 2 — Structure Shift:
After the liquidity grab, the institution has filled its position. Now price reverses aggressively. This reversal breaks the prior market structure — creating either a Change of Character (CHoCH) if it reverses the previous trend, or confirming a Break of Structure (BOS) continuation if it aligns with the existing trend. The structure event is the confirmation that the liquidity sweep was genuine, not noise.
Phase 3 — Delivery:
With positions filled and structure confirmed, the institution delivers price to its target. This delivery phase is what SURGE is designed to capture — entering at the moment the sweep and structure confirmation align with the broader institutional context.
AlphaX SURGE does not simply detect these phases independently. It requires them to occur in the correct sequence and within a qualifying multi-layer confluence environment before any signal fires.
━━━━━━━━━━━━━━━━━━━━━━━━━━━━━━━━━━━━━━━━
💧 Liquidity Sweep Detection
The sweep detection engine identifies the moment institutions grab liquidity from a significant swing level. Every swing high and swing low is tracked in real time using a configurable pivot length (default: 5 bars). These levels represent the two most important current liquidity pools — the sell-side liquidity (SSL) below the most recent swing low, and the buy-side liquidity (BSL) above the most recent swing high.
Bull Liquidity Sweep (SSL Grab):
The bar's low extends below the tracked swing low level by at least the minimum sweep wick threshold (default: 0.05× ATR)
The bar closes back above the swing low level — confirming the wick was a grab, not a genuine breakdown
The bar closes bullish (close above open) — confirming buying pressure on the reversal close
Bear Liquidity Sweep (BSL Grab):
The bar's high extends above the tracked swing high level by at least the minimum wick threshold
The bar closes back below the swing high level
The bar closes bearish — confirming selling pressure on the reversal close
The minimum sweep wick filter is a critical quality gate. Without it, any bar that briefly touches a swing level and reverses would register as a sweep. The ATR-normalized wick requirement ensures the grab extended far enough below or above the level to genuinely trigger stop orders — not just grazed the level on low momentum.
Sweep recency: To accommodate the reality that entry signals often develop one bar after the sweep rather than on the sweep bar itself, SURGE accepts sweeps from the current or immediately preceding bar. This one-bar lookback prevents missed entries on fast-moving setups where the structure confirmation fires on the bar immediately following the sweep candle.
Visual output: Every confirmed sweep is marked with a diamond shape — yellow-green below the bar for bull sweeps, red above for bear sweeps — providing instant visual identification of every liquidity grab on the chart.
━━━━━━━━━━━━━━━━━━━━━━━━━━━━━━━━━━━━━━━━
📐 Market Structure Engine — BOS & CHoCH
The market structure engine runs a real-time tracking system for the current structural trend and identifies every significant structure event as it occurs.
Structural trend tracking:
The engine continuously tracks the most recent confirmed swing high and swing low. When price closes above the most recent swing high, a bullish structure break is detected. When price closes below the most recent swing low, a bearish structure break is detected. The structural trend variable updates on every such event — shifting between bullish (1) and bearish (-1) states.
Change of Character (CHoCH):
A CHoCH occurs when a structure break happens in the opposite direction of the current structural trend. A bullish CHoCH means price was in a bearish structural trend and has now broken above a swing high — the character of the market has changed. A bearish CHoCH is the inverse. CHoCH events are the highest-quality structure signals in the system — they represent a genuine reversal of the institutional order flow direction. Labeled on the chart in orange.
Break of Structure (BOS):
A BOS occurs when a structure break aligns with the current structural trend — a continuation event. A bullish BOS in a bullish trend confirms the uptrend is intact. A bearish BOS in a bearish trend confirms the downtrend continues. Labeled on the chart in yellow-green (bull) or red (bear).
Signal type control:
Two settings independently toggle which structure types can trigger signals:
Allow CHoCH Reversal Setups — enables signals on trend-reversal structure events. These are typically the highest-reward setups but require the sweep and confluence conditions to be exceptionally strong
Allow BOS Continuation Setups — enables signals on trend-continuation structure events. These are typically higher-frequency and occur within established directional flows
Both can be enabled simultaneously, giving SURGE the ability to detect both reversal and continuation setups across all market conditions.
━━━━━━━━━━━━━━━━━━━━━━━━━━━━━━━━━━━━━━━━
📦 Order Block Detection & Visualization
Every confirmed structure event automatically spawns an Order Block — the institutional supply or demand zone that preceded the structure break. Order blocks represent the price range where the institutional position was built before the delivery move.
How order blocks are spawned:
When a bullish CHoCH or bullish BOS is confirmed, SURGE looks back up to the configured lookback period (default: 12 bars) to find the most recent bearish candle prior to the structure break — the last selling candle before the institutional buying move began. The high and low of that candle become the bull order block zone.
When a bearish CHoCH or bearish BOS is confirmed, SURGE looks back to find the most recent bullish candle — the last buying candle before the institutional selling move began. That candle's range becomes the bear order block zone.
Why this candle: The last opposing candle before a major directional move is where institutions were absorbing the final counterparty orders. It is the true origin of the move — and the zone where unfilled institutional orders are most likely to remain, making it the natural magnet for price on any retest.
Order block visualization: Each order block is rendered as a semi-transparent box extending forward by the configured number of bars (default: 20). Bull order blocks are shaded yellow-green; bear order blocks in red. The most recent active order block of each direction is tracked by the confluence system.
━━━━━━━━━━━━━━━━━━━━━━━━━━━━━━━━━━━━━━━━
⚖ Premium / Discount Zone Engine
The Premium/Discount framework is one of the most powerful filtering tools in institutional price action analysis. It answers a simple question: is price currently cheap or expensive relative to the recent dealing range?
Dealing range calculation:
On every bar, SURGE calculates the highest high and lowest low over the configured range length (default: 50 bars). The midpoint of this range is the Equilibrium level — the 50% point of the current dealing range, plotted as a purple dotted line on the chart.
Discount zone: Price at or below equilibrium. From an institutional perspective, price is cheap — this is where smart money buys. Bull entries in discount align with the institutional buying thesis.
Premium zone: Price at or above equilibrium. Price is expensive — this is where smart money sells. Bear entries in premium align with the institutional selling thesis.
Why this filter dramatically improves accuracy: A bullish sweep and structure confirmation at premium prices is a low-quality setup — you are buying at the top of the range where institutions are looking to distribute, not accumulate. The same bullish setup in discount is a structurally superior entry — buying at the institutional accumulation zone where the reward-to-risk profile is fundamentally better. The PD zone filter enforces this discipline automatically, blocking counter-PD setups before they reach the confluence gate.
The PD filter can be toggled off for traders who prefer to trade all qualifying setups regardless of range position — useful on strongly trending markets where price consistently stays on one side of equilibrium.
━━━━━━━━━━━━━━━━━━━━━━━━━━━━━━━━━━━━━━━━
📡 HTF Bias Filter — Multi-Timeframe Alignment
The Higher Timeframe Bias filter is one of the most consequential filters in the entire system. A setup that occurs against the higher timeframe trend is a counter-trend trade — it may look compelling on the current timeframe but is fighting the dominant institutional flow.
How it works:
SURGE pulls two EMAs from the configured higher timeframe (default: 60-minute) — a fast EMA (default: 21) and a slow EMA (default: 55). When the fast HTF EMA is above the slow HTF EMA, the higher timeframe trend is bullish. When below, it is bearish.
Bull bias: Fast HTF EMA above slow HTF EMA — the higher timeframe institutional flow is upward. Bull setups on the current timeframe are with-trend trades.
Bear bias: Fast HTF EMA below slow HTF EMA — the higher timeframe flow is downward. Bear setups are with-trend trades.
The power of HTF alignment in SMC trading: A bullish sweep and CHoCH on M5 in the direction of a confirmed H1 uptrend is a fundamentally different trade from the same setup occurring against an H1 downtrend. The HTF filter ensures SURGE only fires setups where the current timeframe structure event is aligned with the broader institutional delivery direction — the single highest-quality filter available for SMC-based systems.
The HTF timeframe is fully configurable. For M1–M5 scalping, H1 is the default. For M15–H1 trading, H4 or Daily is recommended.
━━━━━━━━━━━━━━━━━━━━━━━━━━━━━━━━━━━━━━━━
🧠 The 6-Layer Confluence Engine
All six layers score independently on every bar. A signal only fires when the score meets the configured minimum (default: 4 of 6), the sweep condition is active, a qualifying structure event has occurred, and the ADX, session, and cooldown conditions are met.
━━━━━━━━━━━━━━━━━━━━━━━━━━━━━━━━━━━━━━━━
Layer 1 — Liquidity Sweep
The foundational layer. Awards 1 point when a qualifying liquidity sweep (SSL for bull, BSL for bear) has occurred on the current or immediately preceding bar. This layer is also a hard requirement — regardless of the confluence score, no SURGE signal can fire without a recent sweep. This is the event that initiates the institutional sequence. Without a genuine liquidity grab, the setup is not a SURGE setup.
━━━━━━━━━━━━━━━━━━━━━━━━━━━━━━━━━━━━━━━━
Layer 2 — Market Structure
Awards 1 point when the current structural trend agrees with the signal direction — a bullish structural trend for bull signals, bearish for bear. The structure layer also enforces the structure type requirement : a qualifying CHoCH or BOS must have occurred (subject to the Allow CHoCH / Allow BOS settings) for a signal to fire. Structure is both a scoring layer and a hard prerequisite, identical to the sweep requirement.
━━━━━━━━━━━━━━━━━━━━━━━━━━━━━━━━━━━━━━━━
Layer 3 — Premium / Discount Zone
Awards 1 point when price is in the correct PD zone for the signal direction — discount for bull signals, premium for bear signals. When the PD filter setting is off, this layer always votes in favor. This layer encodes the institutional value positioning principle: buy cheap, sell expensive.
━━━━━━━━━━━━━━━━━━━━━━━━━━━━━━━━━━━━━━━━
Layer 4 — HTF Bias
Awards 1 point when the higher timeframe EMA structure agrees with the signal direction. This is the multi-timeframe alignment layer — the most macro of the six confluence inputs. When HTF bias is disabled in settings, this layer always votes in favor.
━━━━━━━━━━━━━━━━━━━━━━━━━━━━━━━━━━━━━━━━
Layer 5 — Squeeze Momentum
The TTM Squeeze momentum layer — identical to the implementation in Pulse Scalper and VOID. When the Bollinger Band/Keltner Channel squeeze fires with directional momentum (positive and rising for bull, negative and falling for bear), this layer votes. The orange squeeze background tint provides pre-signal awareness when energy is compressing. A SURGE setup that coincides with a squeeze release means the SMC structure event and the breakout energy event are occurring simultaneously — one of the highest-quality convergences the system can detect.
━━━━━━━━━━━━━━━━━━━━━━━━━━━━━━━━━━━━━━━━
Layer 6 — Volume Delta
The proprietary volume pressure model — splitting each candle's volume into estimated bull and bear components, confirmed by OBV slope. This layer confirms that real institutional capital flow is behind the sweep and structure move. A liquidity sweep with no volume delta confirmation is a weak, potentially algorithmic sweep. A sweep with strong volume delta agreement means genuine order flow drove the grab — the highest-quality sweep condition.
━━━━━━━━━━━━━━━━━━━━━━━━━━━━━━━━━━━━━━━━
🏷 Signal Firing Logic
A SURGE signal fires when all of the following are simultaneously true:
A qualifying liquidity sweep occurred on the current or immediately preceding bar (hard requirement — independent of scoring)
A qualifying structure event (CHoCH or BOS per settings) has confirmed the structural direction (hard requirement)
Confluence score meets or exceeds the configured minimum (default: 4 of 6)
VWAP bias confirms — price above VWAP for bull, below for bear (when VWAP filter is enabled)
ADX confirms a trending market above the minimum threshold
Session filter confirms active market hours
Signal cooldown has elapsed since the last signal in the same direction (default: 10 bars)
Edge triggering: The signal fires only on the bar the conditions first become true — not repeatedly while they remain true. Each triangle is a distinct, fresh setup event.
Score label: Every signal prints the live confluence count (e.g., 5/6 or 6/6 ) directly on the chart so you know the quality of every setup at a glance.
━━━━━━━━━━━━━━━━━━━━━━━━━━━━━━━━━━━━━━━━
🎯 Sweep-Anchored Stop Loss Placement
SURGE includes a purpose-built stop loss mode specifically designed for liquidity sweep setups: SL Beyond Sweep Wick (default: on).
When enabled, the stop loss for a bull entry is placed at the tracked swing low level (the level that was swept) minus an ATR buffer. For a bear entry, the stop is placed at the tracked swing high level plus an ATR buffer.
Why this is the structurally correct stop for sweep setups: The sweep wick represents the maximum extent of the institutional grab. If price returns below the swept swing low (bull) and closes there, the sweep thesis is invalidated — institutions were not grabbing that liquidity for a reversal, the level was genuinely broken. Placing the stop at the swept level is therefore not an arbitrary distance — it is the exact price at which the setup's core premise is proven wrong.
When this setting is off, the stop reverts to a standard ATR distance from the entry bar's low or high.
━━━━━━━━━━━━━━━━━━━━━━━━━━━━━━━━━━━━━━━━
🛡 Dynamic ATR Exit System
Stop Loss: Placed at the swept swing level (when enabled) or bar extreme, plus an ATR buffer (default: 1.3×). Your structural invalidation boundary.
TP1 — Partial Target (50%): 2.0× ATR from entry — slightly wider than the Pulse Scalper and VOID defaults, reflecting the higher-conviction, lower-frequency nature of SURGE setups. Scale out 50% here and move the remainder to breakeven.
TP2 — Full Target: 3.8× ATR from entry. Full position exits on TP2 hit. A labeled TP marker appears on the chart.
ATR Trailing Stop: Dynamic stop advancing with price every bar at 1.6× ATR behind the current bar's extreme. Plotted as a live orange line. In genuine institutional delivery moves following a sweep, price frequently extends well beyond the fixed TP2 — the trail captures this extension without predetermining a ceiling on the gain.
All exit levels are plotted as live lines for the duration of the trade and cleared automatically on exit.
━━━━━━━━━━━━━━━━━━━━━━━━━━━━━━━━━━━━━━━━
📊 Live Dashboard
The real-time dashboard displays the complete internal state across four sections, updated on every bar.
STRUCTURE
Trend — current market structure state: ▲ BULLISH, ▼ BEARISH, or — RANGE. This reflects the confirmed structural trend as tracked by the BOS/CHoCH engine
Liquidity — live sweep detection status: ▲ SSL SWEEP (sell-side grab, bullish signal) or ▼ BSL SWEEP (buy-side grab, bearish signal). Updates in real time on sweep bars
PD Zone — current premium/discount position: ◧ DISCOUNT, ◧ PREMIUM, or — EQ (at equilibrium). Color-coded yellow-green for discount, red for premium
HTF / SESSION
HTF Bias — higher timeframe EMA alignment: ▲ BULL or ▼ BEAR. Confirms whether the macro institutional flow supports the current setup direction
Session — ✓ ACTIVE or ✗ OFF. Confirms whether the session filter is open for signals
ADX — live ADX value with ✓ or ✗ pass/fail indicator
CONFLUENCE
Momentum — squeeze and directional momentum state: ⚡ SQZ (squeeze building), ▲ or ▼ for directional momentum, or — for flat
Vol Delta — volume pressure direction: ▲ BULL, ▼ BEAR, or —
Bull Score — live 0–6 score. Background highlights yellow-green when threshold is met
Bear Score — live 0–6 score. Background highlights red when threshold is met
POSITION
Position — ▲ LONG, ▼ SHORT, or — FLAT with background color highlight
Stop Loss — active SL level (sweep-anchored or ATR-based), color-coded by direction
TP1 — active first take-profit level
Bars in Trade — bars elapsed since entry
━━━━━━━━━━━━━━━━━━━━━━━━━━━━━━━━━━━━━━━━
📈 Chart Visual System
◆ Diamond (below bar, yellow-green) — bull liquidity sweep confirmed. SSL grabbed with close back above the swing low
◆ Diamond (above bar, red) — bear liquidity sweep confirmed. BSL grabbed with close back below the swing high
CHoCH ▲ / CHoCH ▼ label (orange) — Change of Character detected. Trend reversal structure event
BOS ▲ / BOS ▼ label (yellow-green / red) — Break of Structure detected. Trend continuation structure event
▲ Triangle (below bar) — bull SURGE entry. All conditions met
▼ Triangle (above bar) — bear SURGE entry. All conditions met
Score Label (e.g. 5/6) — confluence count at signal time on every entry triangle
Order Block Boxes — semi-transparent zones marking institutional supply and demand origins. Yellow-green for bull OBs, red for bear OBs
Liquidity Level Lines — dashed lines projecting the current swing high (sell-side liquidity, red dashed) and swing low (buy-side liquidity, yellow-green dashed) forward
Equilibrium Line (purple dots) — the 50% midpoint of the current dealing range
EMA Ribbon Fill — yellow-green fill during bull EMA structure, red during bear, gray during flat
VWAP Line (purple) — optional, toggleable session VWAP
Orange Squeeze Background — active during Bollinger/Keltner squeeze compression
Yellow-green background tint — active during open long trades
Red background tint — active during open short trades
SL / TP1 / TP2 / Trail Lines — all four exit levels plotted live for the duration of every trade
━━━━━━━━━━━━━━━━━━━━━━━━━━━━━━━━━━━━━━━━
🚀 How to Trade with AlphaX SURGE — Step by Step
Step 1 — Establish Context Before the Session
Check the dashboard: what is the current structural trend and HTF bias? If both show the same direction, you have macro confluence — prioritize setups in that direction
Check the PD Zone row: is price currently in discount (favor longs) or premium (favor shorts)? Price at equilibrium is the lowest-quality PD position — wait for it to develop to one side
Note where the liquidity level lines are on the chart — these dashed lines mark exactly where the next sweep targets are sitting
Step 2 — Watch for a Sweep Diamond
A yellow-green ◆ diamond below the bar signals an SSL grab — the sweep phase has occurred. The system is now in active scan mode for a SURGE signal
A red ◆ diamond above the bar signals a BSL grab
The sweep is the trigger for your attention — not the entry signal. The entry comes next
Step 3 — Confirm the Structure Event
Watch for a CHoCH or BOS label to appear following the sweep. A CHoCH after a sweep is the highest-quality sequence — institutional grab followed by genuine trend reversal confirmation
Check the confluence scores on the dashboard. After a sweep, the bull or bear score should be climbing toward the threshold as the structure, PD, and momentum layers align
Step 4 — Enter on the SURGE Triangle
A ▲ triangle confirms all conditions are met for a long. A ▼ triangle confirms all conditions for a short
Read the score label. A 6/6 signal means every layer — sweep, structure, PD zone, HTF bias, momentum, and volume — are all aligned simultaneously. These are the highest-conviction setups SURGE produces and warrant full position size
A 4/6 or 5/6 signal is still a valid SURGE entry — standard position size, strict stop management
Step 5 — Manage with Live Exit Lines
The SL line is your swept level invalidation. If the sweep level is retaken cleanly, the setup thesis is gone
Watch the orange trail line advance with price as the institutional delivery move develops
At TP1, scale out 50% and move the remainder to breakeven — let the trail capture the full delivery
Step 6 — Exit and Reset
A TP marker confirms TP2 reached — full exit and system reset
An SL marker confirms stop or trail triggered — close the position and wait for the next sweep event to develop
Do not re-enter on impulse after a stopped trade. The swept level that was just violated is now the new liquidity target for the next setup. Wait for the next clean sweep and structure sequence
━━━━━━━━━━━━━━━━━━━━━━━━━━━━━━━━━━━━━━━━
⚠ Identifying Low-Quality Conditions — When Not to Trade
Stand aside when:
HTF Bias opposes the setup direction — a bullish sweep and CHoCH against an H1 downtrend is a counter-trend reversal trade. The institutional macro flow is working against you. These setups fail at a much higher rate than with-trend entries
PD Zone is wrong for the direction — a bull setup in premium or a bear setup in discount means you are entering at the institutionally unfavorable side of the range. Wait for price to correct to the appropriate zone
Sweep occurred but no CHoCH or BOS followed — a sweep without structure confirmation means the liquidity grab did not produce a genuine reversal or continuation. The institution may have filled only part of its position. Wait for structure to develop
ADX ✗ — the market is not trending. SMC concepts work best in directional markets. In ranging conditions, sweeps are frequently noise events rather than institutional accumulation
Score stuck at 2 or 3 of 6 after a sweep — the confluence environment is too fragmented. Too many layers are disagreeing. A sweep in isolation is not a trade
Multiple sweeps in rapid succession without entry signals — choppy markets produce repeated liquidity grabs in both directions. The confluence gate will block most of these, but the underlying message is that the market is in an oscillating range — not the institutional delivery environment SURGE is designed for
Structure trend and HTF bias are both — or FLAT — no clear institutional direction exists. No SURGE setup can develop until structural bias is established
What to do:
Wait for HTF bias and structural trend to align in the same direction — this is the macro setup condition for the highest-quality SURGE signals
Wait for price to reach the correct PD zone for the anticipated direction before the sweep occurs — the ideal sequence is: price in discount, SSL sweep, bullish CHoCH, 5–6/6 confluence signal
Watch the liquidity level lines — price approaching a level is the pre-alert that a sweep may be imminent. Prepare your confluence scan as price approaches those lines
━━━━━━━━━━━━━━━━━━━━━━━━━━━━━━━━━━━━━━━━
⚡ Key Features
💧 Real-time liquidity sweep detection — identifies SSL and BSL grabs with minimum ATR wick filter and close-back confirmation, eliminating noise sweeps
📐 Full market structure engine — tracks swing highs and lows, detects CHoCH and BOS events, maintains a live structural trend state
📦 Automatic order block detection — spawns OB zones on every confirmed structure event, marking the exact institutional origin of each move
⚖ Premium/Discount zone filter — enforces institutionally correct entry positioning using a dynamic equilibrium level across the recent dealing range
📡 HTF bias filter — pulls a dual-EMA structure from a configurable higher timeframe to confirm macro institutional flow alignment
🧠 6-layer confluence gate — Sweep, Structure, PD Zone, HTF Bias, Squeeze Momentum, and Volume Delta must reach the minimum score threshold before a signal fires
📊 Live confluence scoring — bull and bear scores updated every bar, displayed on the dashboard before any signal appears
🔀 CHoCH / BOS signal type control — independently enable reversal setups, continuation setups, or both
🎯 Sweep-anchored stop loss — places the SL at the structural invalidation level (the swept swing point) rather than an arbitrary ATR distance
⚡ TTM Squeeze integration — Bollinger/Keltner compression detection flags pre-breakout energy with orange background tint and dashboard state
📈 Proprietary volume delta model — estimates institutional order flow pressure without exchange-level data, confirmed by OBV slope
🌐 VWAP session bias — enforces institutional session direction alignment on every signal
🛡 Dynamic ATR trailing stop — orange line advances with price every bar, capturing full institutional delivery moves beyond the fixed TP2
💹 Liquidity level lines — dashed projections of the current swing high and swing low showing exactly where the next liquidity pools sit
📊 22-row live dashboard — Structure, HTF/Session, Confluence, and Position sections updated in real time
🔔 12 alert conditions — sweep events, CHoCH events, entry signals, TP1/TP2 hits, and stop hits for both directions
🎨 Fully cohesive dual-tone color system — yellow-green for all bullish elements, red for all bearish, orange for squeeze and trail, purple for VWAP and equilibrium
⚙ Fully configurable — all pivot lengths, OB parameters, PD range, HTF timeframe and EMA periods, confluence minimum, ADX threshold, exit multipliers, session window, and all colors are independently adjustable
━━━━━━━━━━━━━━━━━━━━━━━━━━━━━━━━━━━━━━━━
⚙ Settings Reference
Structure & Liquidity
Swing Pivot Length — bars used for pivot high/low detection. Controls the significance of swing levels tracked for sweeps and structure (default: 5)
Show BOS / CHoCH Labels — toggle structure event labels on the chart
Show Liquidity Levels — toggle the dashed swing high and swing low projection lines
Liquidity Line Extend — how many bars forward the liquidity level lines project (default: 25)
Min Sweep Wick (ATR x) — minimum wick extension beyond the swing level required to register a sweep (default: 0.05× ATR)
Order Blocks
Show Order Blocks — toggle OB zone boxes on or off
Max Order Blocks — maximum OBs stored in memory simultaneously (default: 25)
OB Extend (bars) — how many bars forward OB boxes project (default: 20)
OB Lookback Bars — how many bars back to search for the origin candle when spawning an OB (default: 12)
Premium / Discount
Show Equilibrium Line — toggle the dealing range midpoint line
Dealing Range Length — bars used to calculate the high/low range for PD zone positioning (default: 50)
Require Correct PD Zone — when on, longs require discount positioning and shorts require premium positioning (default: on)
HTF Bias
Use HTF Trend Filter — toggle the higher timeframe bias requirement
HTF Timeframe — the higher timeframe to pull EMA data from (default: 60-minute)
HTF Fast EMA — fast EMA period on the HTF (default: 21)
HTF Slow EMA — slow EMA period on the HTF (default: 55)
EMA Ribbon
Fast / Slow / Signal EMA — triple ribbon periods (defaults: 8 / 21 / 50)
Show EMA Ribbon — toggle ribbon fill and line plots
Squeeze Momentum
BB Length / BB Mult — Bollinger Band parameters (defaults: 20 / 2.0)
KC Length / KC Mult — Keltner Channel parameters (defaults: 20 / 1.5)
Momentum Length — linear regression momentum period (default: 12)
Volume Delta
Volume MA Length — EMA smoothing for volume estimates (default: 14)
OBV Slope Length — lookback for OBV slope directionality (default: 10)
VWAP
Use VWAP Filter — when on, requires price to be on the correct VWAP side for each signal direction
Show VWAP Line — toggle VWAP line on the chart
Confluence Gate
Min Layers Required — minimum confluence votes needed for a signal (default: 4 of 6)
Session Filter — toggle active hours restriction
Active Session — configurable session window (default: 0700-2000)
Signal Cooldown — minimum bars between consecutive signals in the same direction (default: 10)
Allow CHoCH Reversal Setups — enables signals on trend-reversal structure events
Allow BOS Continuation Setups — enables signals on trend-continuation structure events
ADX Filter
Use ADX Filter — toggle the trend quality gate
ADX Length — calculation lookback (default: 14)
ADX Minimum — threshold below which all signals are suppressed (default: 18)
Exit Settings
ATR Length — lookback for all ATR exit calculations (default: 10)
SL ATR Mult — ATR buffer beyond the swept swing level (default: 1.3)
TP1 ATR Mult — first take-profit distance (default: 2.0)
TP2 ATR Mult — full exit target distance (default: 3.8)
Use ATR Trailing Stop — toggle dynamic trailing stop
Trail ATR Mult — trailing distance from current bar's extreme (default: 1.6)
Show Exit Levels — toggle all exit level lines
SL Beyond Sweep Wick — anchors stop to the swept swing level (default: on)
Display
Show Confluence Score Label — prints live score on every signal triangle
Show Dashboard — toggle the full dashboard
Dashboard Position — Top Left / Top Right / Bottom Left / Bottom Right
Colors
Bull / Bull Bright — yellow-green family for all bullish signals, fills, and labels
Bear / Bear Bright — red family for all bearish signals, fills, and labels
Squeeze — orange for squeeze tint and trailing stop line
EMA Fast / Slow / Signal — individual EMA line colors
Ribbon Fill Bull / Bear / Flat — ribbon fill colors for each trend state
Buy-Side / Sell-Side Liquidity — liquidity level line colors
Bull / Bear Order Block — OB box fill and border colors
Equilibrium Line — dealing range midpoint color (default: purple)
VWAP Line — VWAP plot color
BOS Bull / BOS Bear / CHoCH — structure label colors
Bull / Bear Sweep Marker — sweep diamond colors
SL / TP / TP2 / Trail Lines — individual exit level line colors
Long Zone BG / Short Zone BG — active trade background tints
Bull / Bear Label Text — score label text colors
Dash Text / Dash BG / Dash Header / Dash Section / Dash Frame — full dashboard color control
━━━━━━━━━━━━━━━━━━━━━━━━━━━━━━━━━━━━━━━━
🔔 Alert Conditions (12 total)
Liquidity Alerts
Bull Liquidity Sweep — sell-side liquidity grabbed, watch for long setup development
Bear Liquidity Sweep — buy-side liquidity grabbed, watch for short setup development
Structure Alerts
Bull CHoCH — bullish Change of Character confirmed, structural trend shifting to bullish
Bear CHoCH — bearish Change of Character confirmed, structural trend shifting to bearish
Entry Alerts
Bull SURGE Entry — all conditions met: sweep, structure, confluence, ADX, session
Bear SURGE Entry — all conditions met for a short institutional sweep entry
Exit Alerts
Bull TP1 Hit — scale out 50% of long position
Bull TP2 Hit — full long position exit
Bull Stop Hit — stop loss or trail triggered on long
Bear TP1 Hit — scale out 50% of short position
Bear TP2 Hit — full short position exit
Bear Stop Hit — stop loss or trail triggered on short
All alert messages are formatted as const strings for clean webhook and notification platform integration.
━━━━━━━━━━━━━━━━━━━━━━━━━━━━━━━━━━━━━━━━
🎯 Recommended Settings by Instrument & Timeframe
The default configuration is optimized for XAUUSD, major forex pairs, and crypto on M1–M15 :
Min Layers at 4/6 — strong confluence while accounting for the complexity of the 6-layer system
HTF at 60-minute — provides meaningful higher timeframe context for intraday M1–M15 setups
Sweep wick at 0.05× ATR — sensitive enough to catch genuine institutional grabs without registering micro-noise sweeps
SL Beyond Sweep Wick on — structurally anchored stop placement at the institutional invalidation level
Allow CHoCH and BOS both on — captures both reversal and continuation setups in the full range of institutional delivery scenarios
For other instruments or timeframes, adjust:
Higher timeframes (H1, H4) — set HTF to Daily or Weekly, increase Swing Pivot Length to 8–10, increase TP2 to 5.0–6.0× ATR, raise Min Confidence to 5/6
Crypto (BTC, ETH) — increase Min Sweep Wick to 0.1–0.15× ATR to filter out the higher frequency of noise sweeps in volatile crypto sessions, increase KC Mult to 2.0
Indices (NAS100, US30) — tighten session to 09:30–16:00, increase ADX minimum to 22, set HTF to H4 for intraday M5–M15 trading
CHoCH-only mode — disable Allow BOS Continuation, raise Min Layers to 5/6. This produces the fewest signals but each represents a genuine trend reversal with maximum institutional evidence
More signals — lower Min Layers to 3, reduce Cooldown, disable PD Zone requirement, disable HTF filter
━━━━━━━━━━━━━━━━━━━━━━━━━━━━━━━━━━━━━━━━
👥 Who This Is For
🏦 Smart money concepts and ICT methodology traders — SURGE is the quantitative implementation of the core SMC trading sequence: liquidity grab, structure shift, PD zone entry. Everything you execute manually in an SMC framework is automated and filtered here
🥇 Gold (XAUUSD) and forex traders — institutional order flow mechanics are most consistent and powerful on these instruments. Default settings are calibrated for gold intraday
📊 Multi-timeframe traders — the HTF bias filter is built for traders who use higher timeframe confluence as a core component of their trade selection process
🎯 Traders who want to stop buying highs and selling lows — the PD zone filter enforces the discipline of buying in discount and selling in premium, the foundational institutional positioning principle
🧠 Systematic traders — the 6-layer confluence score provides a fully quantified quality metric for every setup, replacing subjective SMC judgment with objective numerical scoring
📈 Traders who want to trade with institutions, not against them — every component of SURGE — the sweep detection, structure engine, PD zone, HTF filter, order blocks, and liquidity lines — is designed to identify and align with genuine institutional order flow
⚠ Traders who struggle with SMC subjectivity — traditional SMC analysis requires significant discretion. SURGE removes that discretion by encoding the rules objectively and applying them consistently on every bar across all instruments and timeframes
━━━━━━━━━━━━━━━━━━━━━━━━━━━━━━━━━━━━━━━━
📝 Notes
All signals are confirmed on bar close — the indicator is non-repainting by design. Structural trend tracking, sweep detection, and confluence scoring all finalize on confirmed bars only
The swing pivot detection has an inherent offset of swingLen bars — a pivot is only confirmed after swingLen bars have passed to the right of the pivot bar. This is standard for pivot-based systems and is not repainting — it is real-time confirmation
Order blocks are spawned on structure confirmation bars. The OB origin candle is the most recent opposing candle within the lookback window prior to the structure event — representing the genuine institutional origin zone
The structural trend variable is persistent — once a bullish trend is established by a BOS/CHoCH, it remains bullish until a bearish structure break occurs. This means the structure layer can remain in a favorable state across many bars between signals
Maximum 500 labels and 500 lines and 300 boxes are rendered. On very active low-timeframe charts with long history, oldest labels, order block boxes, and liquidity lines may be removed by TradingView's rendering limits
The VWAP calculation resets at each session start. On 24-hour crypto instruments, consider disabling the VWAP filter for best system behavior
The Trade Status section tracks position direction from signal to exit within the chart session — it does not connect to your broker or brokerage account
━━━━━━━━━━━━━━━━━━━━━━━━━━━━━━━━━━━━━━━━
⚠ Disclaimer
This indicator is a technical analysis and visualization tool intended for educational and informational purposes only. It does not constitute financial advice or a recommendation to buy or sell any financial instrument. All signals are generated from historical and real-time price data using mathematical calculations — their accuracy or profitability is not guaranteed. Past performance of any signal type does not guarantee future results. Always conduct your own analysis, use proper risk management, and consult a licensed financial advisor before making any trading decisions. The author accepts no responsibility for any losses incurred from the use of this indicator.
━━━━━━━━━━━━━━━━━━━━━━━━━━━━━━━━━━━━━━━━
Built for traders who understand that price moves to take liquidity before it moves to deliver value — and who want a system precise enough to be positioned for that delivery every time.
インジケーター

Daily/Weekly EMA or SMA w Colour SelectorTook pavankjadda 'Daily/Weekly EMA or SMA' and added a colour selector for the MA's. Use this to see the daily/weekly MA's on lower timeframes.
インジケーター

MTF Confluence Dashboard (EMA + RSI + Volume)A multi-timeframe confluence scoring system designed for futures (built and tested on MNQ). Instead of generating signals from a single indicator on a single timeframe, it scores 4 timeframes independently and only flags Buy/Sell when they align.
How it works
Each timeframe (3m, 5m, 15m, 30m) is scored on three components:
EMA Ribbon (7/13/20/50) — bullish when stacked up, bearish when stacked down
RSI (13-period) — bullish above 60, bearish below 40
Volume — confirms direction when volume spikes above 1.5× the 20-bar average
Each component scores +1, 0, or -1, giving each timeframe a score from -3 to +3. The four timeframe scores are summed into a total confluence score from -12 to +12.
Signal logic:
ALIGNED BUY / SELL labels print on the chart when the confluence score crosses ±5
The dashboard table on the right shows live signals for each timeframe, macro trend (above/below 200 EMA), and the overall confluence
A built-in whipsaw filter prevents Buy → Sell → Buy flip-flops by requiring the score to reset to neutral before allowing opposite signals
Built-in features:
Customizable EMA, RSI, and volume settings
Adjustable confluence thresholds
Toggleable EMA plotting on chart
Four alert conditions (Aligned Buy/Sell, Lean Buy/Sell)
Repaint-safe (uses confirmed higher-timeframe data only)
Best used as:
A confluence checker, not an autopilot. ALIGNED signals tell you when multiple timeframes agree on direction — strongest in trending markets, weakest in chop. Pair with your own price action read and risk management.
Notes:
Works best on futures or exchange-traded instruments where volume data is real
Default settings tuned for MNQ on the 5m chart but adjustable for any market/timeframe
MADE USING CLAUDE AI
インジケーター

EMAs + VWAPThis indicator will add the 9, 20, 50, and 200 EMA, as well as VWAP, to your chart.
The EMAs can be adjusted to any number and color.
I grew tired of adding 4 different EMAs and VWAP to my charts, so I added them all to 1 indicator.
インジケーター

Multi MA Framework [Gabremoku]Multi MA Framework is a flexible multi-moving-average overlay built for traders who want a clean and fully customizable MA workspace directly on the chart.
The indicator lets you plot up to four independent moving averages, each with its own:
visibility toggle
length
MA type
color
This makes it useful for traders who want to combine fast and slow averages, compare SMA vs EMA behavior, or build a personalized trend framework without loading multiple separate indicators.
What it shows
📈 Up to 4 Moving Averages — each line can be configured independently and displayed only when needed.
⚙️ SMA or EMA per line — choose the moving average type separately for each MA. SMA gives equal weight to all values in the period, while EMA gives more weight to recent prices and typically reacts faster to change.
🏷️ End Labels — optional right-side labels show each MA name, type, and length.
☁️ Cloud Fills — optional fills between:
MA 1 / MA 2
MA 3 / MA 4
These clouds help visualize alignment and separation between faster and slower averages.
Core idea
This script is designed as a moving average framework, not a rigid strategy.
Moving averages are commonly used to:
identify trend direction
smooth noisy price action
monitor dynamic support and resistance
compare short-term and long-term market structure
By allowing different lengths and SMA/EMA choices on every line, the script makes it easy to create your own structure, for example:
fast trend stack
swing trend map
long-term bias model
crossover-based workflow
How to use
A practical way to use the framework is to combine shorter and longer averages.
For example:
a shorter MA can track immediate momentum
a medium MA can define swing direction
a longer MA can define higher-level trend bias
When multiple moving averages align in the same direction, traders often interpret that as stronger trend structure. Crossovers between faster and slower averages are also widely used to monitor possible trend shifts, although they are lagging by nature.
Example setups
Here are some common ways this framework can be configured:
Trend stack: 10 EMA / 20 EMA / 50 EMA / 200 SMA
Swing trader view: 20 EMA / 50 SMA / 100 SMA / 200 SMA
Minimal structure: show only 2 lines and enable one cloud
Cross comparison: use SMA on one line and EMA on another with the same or similar length to compare responsiveness
Because EMA reacts faster and SMA is smoother, combining both can help balance responsiveness and stability.
Features
✅ Up to 4 fully independent moving averages
✅ SMA or EMA selection for each line
✅ Custom length for each MA
✅ Custom color for each MA
✅ Visibility toggle for every line
✅ Adjustable line width
✅ Optional right-side end labels
✅ Optional MA1/MA2 cloud fill
✅ Optional MA3/MA4 cloud fill
✅ Clean chart overlay design
Notes
This indicator is best used as a custom trend structure tool rather than a standalone signal engine. Moving averages are inherently lagging indicators, so they are most effective when used to define context and trend bias rather than predict reversals on their own.
Author: Gabremoku
Pine Script v6
インジケーター

21 EMA Bounce + VRVP + RSISummary of what's in the code:
Daily 21 EMA: The main signal line for bounces.
Daily 55 EMA: Used to ensure you only trade in the direction of the long-term trend.
RSI Filter: Filters out signals when momentum is weak or over-extended.
Volume Profile (VRVP): Automatically draws a profile of the last 200 bars with a Red POC (Point of Control) line.
Candle Patterns: Detects Pin Bars and Engulfing patterns at the EMA for extra confirmation.
インジケーター
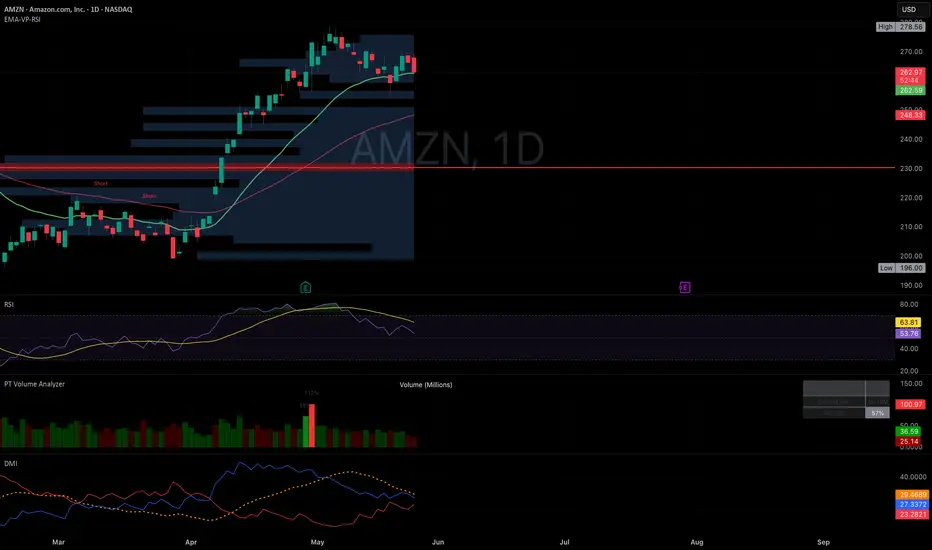
20/50 EMA Cloud w/ Optional RibbonThis indicator plots a dynamic cloud between the 20 and 50 EMAs, filled green during bullish trend conditions and red when bearish. The cloud gives you an instant read on trend direction and momentum strength at a glance — a wide, expanding cloud signals a strong move, while a narrowing cloud is an early warning that momentum may be fading.
An optional ribbon fills the space between the two EMAs with intermediate lines spanning from 20 to 50. When enabled, this makes it easy to see whether the trend is accelerating or starting to compress before it becomes obvious in price.
Three additional EMAs are included and can each be toggled on or off independently. The 9 EMA in purple tracks short-term momentum and is useful for timing pullback entries. The 100 EMA in gold acts as a mid-range reference. The 200 EMA in cyan is the macro trend line — the most important level on the chart for understanding the bigger picture bias.
This is a trend filter and context tool, not a signal generator. It works best when used alongside volume profile, VWAP, and order flow analysis as part of a broader confluence-based approach. The cloud tells you the environment you're trading in — what you do with that information is up to you.
インジケーター

Trend Volatility RegimeThe Trend Volatility Regime is an all-in-one trend-following model that identifies changes in the market regime by combining moving-average crossover signals with volatility-adaptive trailing stops. It features an integrated backtesting engine that provides institutional-grade insights into historical strategy performance, along with a built-in alert system that notifies investors in real time when regime changes occur. The model integrates seamlessly into the price chart and presents backtest results in a clear, color-coded table benchmarked against buy-and-hold.
At its core, the model combines two complementary trend detection components to determine the prevailing market regime. The first component identifies the underlying structural trend using a volatility-adjusted moving-average crossover based on the spread between fast and slow moving averages. The second component identifies trend reversals using an adaptive trailing stop based on changes in price and volatility. Bullish and bearish regimes occur when both crossover and volatility signals are directionally aligned, while conflicting signals result in neutral regimes.
Bullish Crossover Signal = (Fast MA – Slow MA) > (ATR × Trend Margin)
Bearish Crossover Signal = (Fast MA – Slow MA) < –(ATR × Trend Margin)
Bullish Volatility Signal = Price > (Highest Price – (Volatility × Stop Factor))
Bearish Volatility Signal = Price < (Lowest Price + (Volatility × Stop Factor))
By default, the model applies an asymmetric regime design in which conflicting signals default to a bullish regime unless half-equity positions are enabled in the menu. This asymmetric design reflects the tendency of risk assets to deteriorate gradually while recovering more abruptly. The moving-average component captures the slower deterioration typically observed during market tops, while the trailing stop component responds more dynamically to faster reversals typically observed at market bottoms. This helps reduce overreaction to corrections during uptrends while still allowing for faster re-entry following sharp recoveries. To evaluate the performance of different parameter configurations, the model includes a built-in table with the following metrics:
CAGR = Compounded Annual Growth Rate.
Excess = CAGR in excess of buy-and-hold.
Sharpe = CAGR per unit of standard deviation.
Sortino = CAGR per unit of downside deviation.
Calmar = CAGR relative to maximum drawdown.
Max DD = Largest peak-to-trough decline in value.
Alpha (α) = Excess annualized risk-adjusted returns.
Win Rate = Ratio of profitable trades to total trades.
Profit Factor = Total gross profit per unit of losses.
Expectancy = Average expected return per trade.
Turnover = Average annualized change in exposure.
This indicator is designed with flexibility in mind, enabling users to specify the start date of the backtesting period, the preferred trend type, volatility type, and regime visualization. Supported regime visualizations include line, candle, and shaded background. Supported moving-average types include the Exponential Moving Average (EMA), Simple Moving Average (SMA), Wilder’s Moving Average (RMA), and Weighted Moving Average (WMA). Supported volatility types include the Average True Range (ATR), Standard Deviation (SD), and Mean Absolute Deviation (MAD). Supported price sources include Close, HL2, HLC3, and OHLC4. The table follows an intuitive color-coded logic that allows for quick performance comparison against buy-and-hold (B&H):
CAGR = Green indicates above 0%, while red indicates below 0%.
Excess = Green indicates above 0%, while red indicates below 0%.
Sharpe = Green indicates better than B&H, while red indicates worse.
Sortino = Green indicates better than B&H, while red indicates worse.
Calmar = Green indicates better than B&H, while red indicates worse.
Max DD = Green indicates better than B&H, while red indicates worse.
Alpha (α) = Green indicates above 0%, while red indicates below 0%.
Win Rate = Green indicates above 50%, while red indicates below 50%.
Profit Factor = Green indicates above 2, while red indicates below 1.
Expectancy = Green indicates above 0%, while red indicates below 0%.
In summary, the Trend Volatility Regime is a comprehensive trend-following tool designed to help investors stay on the right side of the market by identifying key changes in the market regime. By combining volatility-adjusted moving-average crossover signals with adaptive volatility-based trailing stops, the model seeks to maximise participation during uptrends while reducing exposure during sustained downtrends. While the model provides valuable historical insights, users should remain mindful that past results may not necessarily persist under future market conditions.
インジケーター

AlgoStorm Institutional VWAP Suite (IVS)AlgoStorm Institutional VWAP Suite (IVS)
A multi-anchor, institutional-grade VWAP framework covering five distinct time horizons simultaneously — Daily, Rolling Time-Window, NY, European/London, and Asian/Pacific — with volume-weighted standard deviation bands, a configurable color suite, a live info table, and full alert coverage.
The AlgoStorm Institutional VWAP Suite (IVS) is built on a single conviction: VWAP is not a single line, it is a layered structural map. Professional traders and institutions do not reference one VWAP — they read the relationship between multiple anchored VWAPs across sessions and time windows to understand where the auction is relative to where it has been. IVS makes this entire multi-anchor framework available in one cohesive, configurable overlay, designed for futures, equities, forex, and any instrument with reliable volume data.
Why Multiple VWAPs?
Each anchor tells a different story. The Daily VWAP defines where the current session is balanced. The Rolling VWAP reflects dynamic equilibrium over a configurable time window, acting as a responsive benchmark for swing and position traders. The session VWAPs — NY, London, and Asia — reveal the price acceptance or rejection developing within each regional trading block. When price holds above the NY VWAP but stalls beneath the Daily VWAP, that tension itself is actionable information. IVS maps all five references simultaneously so those relationships are always visible.
Technical Architecture
Each VWAP anchor is computed through a dedicated VwapInstance User-Defined Type (UDT). This object maintains the running sums required for both the VWAP price and the volume-weighted population standard deviation, using the mathematically correct formula σ² = E − E ² . Deviation bands derived from this are true volume-weighted standard deviations — not ATR estimates or fixed percentage offsets.
The Rolling VWAP runs on a High-Fidelity Sliding Time-Window Engine . Rather than anchoring to a calendar boundary, it maintains four parallel arrays (price-volume, volume, squared price-volume, and timestamps) to continuously evict data older than the user-defined window. This produces a genuinely time-accurate rolling VWAP at any timeframe, not a bar-count approximation.
Session resets (NY, London, Asia) use a one-minute anchor window via time("1", range, timezone) , which fires accurately across all chart timeframes — not just 1-minute charts.
Features & Functionality
Daily VWAP: Anchors at each calendar day open using hlc3 as the price source. Resets correctly on the first bar of every session including overnight gaps. Paired with optional volume-weighted standard deviation bands (two configurable multipliers for ±1σ and ±2σ levels).
Daily VWAP Wave (H/L): Plots two companion VWAPs anchored to the daily high and low respectively, with a filled channel between them. This "wave" shows the intraday auction range as a structural envelope rather than a single midline — price inside the wave indicates balance, price outside indicates initiative direction.
Rolling Time-Window VWAP: Fully configurable window in days, hours, and minutes. Defaults to 1 day. Paired with optional volume-weighted standard deviation bands. Unlike a fixed daily anchor, the rolling VWAP adapts continuously, making it a natural trend reference for intraday and swing traders.
NY Session VWAP: Anchors at 09:30 ET (New York open). The primary reference for equities and US futures RTH participants. Resets each session regardless of the chart's display timezone.
European / London Session VWAP: Configurable anchor at either 03:00 ET (London) or 02:00 ET (Frankfurt). Essential for tracking European institutional participation, particularly on DAX and EUR/USD.
Asian / Pacific Session VWAP: Configurable anchor at either 20:00 ET (Tokyo) or 18:00 ET (Sydney). Useful for establishing overnight reference levels and identifying the range that NY will either accept or reject at the open.
Color Suite: Every line has an independently configurable color input. The defaults (Silver, White, Blue, Lime, Red, Yellow) are chosen for visual hierarchy on dark themes, but each can be adjusted for light themes, personal preference, or multi-indicator setups.
Live VWAP Info Table: An optional on-chart table (top-right, togglable) displaying the current numeric value of all six active VWAP levels, color-coded to match their respective lines. Values display as — for any anchor that has not yet reset in the current session. Populated only on the last bar to avoid unnecessary per-bar overhead.
10 Alert Conditions: Cross-above and cross-below alerts for every VWAP line. Alerts fire on bar close (confirmed bar only) to prevent repainting. Each message includes {{ticker}} and {{close}} placeholders for use in webhook automations or notification routing.
Usage Guide
For intraday futures traders (ES, NQ, DAX): Enable the Daily VWAP Wave and NY VWAP as your primary references. Price reclaiming the NY VWAP after a morning flush is a high-probability mean-reversion setup. Price pushing beyond the Daily Wave High with sustained delta confirms initiative buying.
For swing and multi-day traders : The Rolling VWAP is your core tool. Set the window to 3-5 days and treat it as a dynamic fair value anchor. When price returns to the Rolling VWAP after extended deviation, evaluate whether volume supports continuation or reversal.
For session transition analysis : Enable all three session VWAPs. At the NY open, observe where price is relative to the Asian and London anchors. Acceptance above the London VWAP at NY open is structurally bullish. Rejection and failure below it signals continuation of overnight selling.
For deviation band usage : The ±1σ bands define the statistically normal range for the session. Extended moves to ±2σ with declining volume are classic mean-reversion setups. Moves to ±2σ with expanding volume signal initiative behavior and potential trend continuation.
インジケーター

RSI Dip + EMA Trend Long DCA - IndicatorRSI Dip + EMA Trend Long DCA — Leveraged Indicator
🔷 What it does:
This is a signal-only indicator that mirrors a leveraged dip-buying DCA workflow on crypto perpetuals. It tracks one virtual long position at a time, opened only when an oversold dip and an uptrend confirmation align across two lower timeframes. The indicator manages up to four safety orders as price ladders lower, and exits via three independent paths: take profit with trailing, hard stop loss, or a forced close after a maximum holding period. Every event emits a webhook-ready JSON payload tailored for a DCA Bot configured for leveraged futures.
- Dual confirmation entry: RSI(12) crossing down 35 on 5m AND EMA(50) > EMA(100) on 15m.
- Soft-compounding safety ladder: 4 SOs at 1.05× margin progression, deviations 1.00%, 2.20%, 3.64%, 5.37%.
- Three-exit architecture: 1.0% Take Profit with 0.1% trailing, 9% hard Stop Loss, 3-day Max Hold timeout.
- Default leverage 25×, configurable from 1× upward.
- Honest virtual bookkeeping: total notional and qty updated per fill, avg entry / open PnL displayed live.
🔷 Who is it for:
- Active traders running a DCA Bot on leveraged crypto perpetuals who want a systematic dip-buying engine.
- Bot operators who want a chart-driven signal source with per-event JSON ready for a DCA Bot.
- Traders who want to monitor an evolving leveraged position — base entry, owned SO levels, deployed notional, open PnL, time-to-max-hold — directly on the chart.
- Operators comfortable with portfolio-level drawdowns in the 15–20% range in exchange for accelerated returns.
🔷 How does it work:
Entry RSI Filter (Oversold Dip): A 5-minute RSI(12) is sampled via request.security with lookahead disabled. The dip gate fires when RSI crosses down through 35 — momentum has rolled over into oversold.
EMA Trend Filter: A 15-minute EMA(50) and EMA(100) are sampled in parallel. The trend gate is satisfied only while Fast EMA > Slow EMA — broader trend is up. When the EMA cross flips, the dip signal alone cannot open a virtual position.
Entry: When both gates align at host-bar close, the indicator marks a virtual long entry, captures the base entry price, seeds the cost-basis ledger with base margin × leverage notional, and fires the entry webhook payload.
Safety Order Ladder: After base fill, the indicator monitors close price downward against the position. When close reaches base entry × (1 − cumulative deviation), the k-th SO is marked filled, cost-basis is updated, and the SO webhook payload is fired. No additional gating on the SO ladder — pure price.
Honest Virtual Bookkeeping: Total notional and qty are updated incrementally on every event, so the avg entry, deployed notional, and open PnL displayed in the status table reflect the actual broker-equivalent position state — no shortcut from base entry, no synthetic averaging.
Exit Priority: Three exits evaluated in order on each bar: (1) Stop Loss at 9% below average entry, (2) Maximum Hold timeout from base entry, (3) Take Profit at 1.0% above average entry with 0.1% trailing — once price reaches the TP target, the position closes only after a 0.1% retrace from the in-favor peak.
🔷 Why it's unique:
- Two-Layer Confirmation: RSI dip on 5m for timing, EMA stack on 15m for trend bias. The two filters operate on different scales — momentum exhaustion alone cannot fire a signal against a confirmed downtrend, and trend alignment alone cannot fire outside a tactical entry window.
- Three-Exit Architecture: Most DCA tools use one or two exit conditions. This indicator handles all three failure modes explicitly — hard tail-risk stop, stuck-trade timeout release, and momentum-trailing winner exit.
- Leverage-Aware Sizing: Margin and leverage are independent inputs. The virtual ledger tracks notional position, so the avg-entry line and open PnL reflect the leveraged broker state, not unleveraged cash-only math.
- Per-Event Webhook Ledger: Up to seven distinct events per cycle (entry + 4 SO fills + close + max-hold/SL), each with its own JSON alert payload. The indicator drives a DCA Bot end-to-end through a single TradingView alert.
🔷 Considerations Before Using the Indicator:
Market & Timeframe: Designed for liquid crypto perpetuals on 15m. Default thresholds are calibrated for XMRUSDT.P 15m. Different pairs may need EMA period and RSI threshold tuning.
Leverage Warning: The default 25× leverage is aggressive. The companion strategy's backtest at default settings produced 18.01% maximum drawdown — substantially above the 5–10% per-trade band, although that figure reflects portfolio-level accumulation across 779 trades, not single-trade risk. Lower the leverage input to dial down portfolio-level drawdown proportionally.
Cross Detection Granularity: Entries and SO fills are evaluated on bar close. A bar that spikes through a level and returns within the same bar may be missed by design — this matches realistic polling behavior and avoids over-signaling on intra-bar wicks.
Live vs Historical State: The virtual position state is rebuilt from chart history each time the indicator is recompiled. If the indicator is added mid-deployment or the live bot diverges from the signal stream (manual interventions, partial fills), the indicator state may not match the live bot. Toggle the indicator off and on to reset.
No SO Condition: Safety orders fire on pure price ladder with no momentum gate — averaging continues unconditionally as price drops, until SL, MaxHold, or price reversal. Higher average-entry quality in shallow dips; greater unrealized exposure on sharp drops.
Maximum Hold Timeout: The 3-day forced close exists to release capital from stuck trades. The indicator dispatches a close webhook the moment the timeout fires — verify the receiving DCA Bot accepts unconditional close commands.
Funding Rates (Perpetuals): The indicator does not account for perpetual funding rates. Sustained negative funding improves live performance for this long strategy; sustained positive funding degrades it. Review the historical funding pattern before live deployment.
Backtesting Note: This is an indicator, not a strategy. There is no built-in P&L tester. For performance metrics over a 14-month sample (~779 closed trades, 74.07% win rate, 18.01% max drawdown, profit factor 1.313, +30.79% net return), use the companion strategy version on identical parameters.
🔷 How to Use It:
🔸 Add the indicator to a 15m chart on the leveraged perpetual pair you want to trade.
🔸 Review the entry filters (RSI on 5m, EMA stack on 15m), the 4-SO ladder, and the three exit conditions. Defaults are calibrated for XMRUSDT.P 15m at 25× leverage — recalibrate per asset and per risk tolerance before deploying.
🔸 Set leverage and base margin to match your exchange and account configuration. Lower leverage scales portfolio-level drawdown proportionally.
🔸 In the DCA Bot Webhook group, paste the Bot ID, Email Token, and Pair (QUOTE_BASE format, e.g., USDT_XMR).
🔸 Create an alert on the indicator with "Any alert() function call". Paste the DCA Bot's webhook URL into the alert's Webhook field. The indicator will emit JSON payloads for entry, each safety order, and all three close types — formatted for direct DCA Bot consumption.
🔷 INDICATOR SETTINGS
Base Order Margin (USDT): Margin per base trade. Notional = Margin × Leverage. Used for the virtual avg-entry / open-PnL computation.
Leverage (×): Exchange leverage. Default 25×.
Max Safety Orders: Maximum number of safety orders per cycle (default 4).
First SO Margin (USDT): USDT margin of the first safety order; subsequent SOs scale by the Size Multiplier.
Step to First SO (%): Distance from base entry at which SO1 becomes eligible.
Step Multiplier: Ladder factor that widens each subsequent deviation step.
Size Multiplier: Factor that grows each subsequent safety order's USDT margin.
Entry RSI Timeframe / Length / Level: Lower-timeframe RSI oversold-dip filter.
EMA Timeframe / Fast / Slow: Higher-timeframe trend confirmation filter.
Take Profit (%) / Trailing Deviation (%): TP target above avg entry and trailing buffer.
Stop Loss (%): Hard stop below avg entry.
Force Close After Max Hold / Max Hold (seconds): Timeout for forced market close.
DCA Bot Webhook: Bot ID, Email Token, and Pair fields injected into every alert payload.
Visualization: Toggle SO Ladder, Avg / TP / SL plot lines, fill labels, signal triangles, status table.
Brand Watermark: Configurable text, position, size, and transparency.
👨🏻💻💭 We hope this tool helps enhance your trading. Your feedback is invaluable, so feel free to share any suggestions for improvements or new features you'd like to see implemented.
__
The information and publications within the 3Commas TradingView account are not meant to be and do not constitute financial, investment, trading, or other types of advice or recommendations supplied or endorsed by 3Commas and any of the parties acting on behalf of 3Commas, including its employees, contractors, ambassadors, etc.
インジケーター

RSI Dip + EMA Trend Long DCA - StrategyRSI Dip + EMA Trend Long DCA — Leveraged Strategy
🔷 What it does:
This is a long-only DCA strategy on leveraged crypto perpetuals that buys oversold dips inside confirmed uptrends. A long entry opens only when the lower-timeframe RSI crosses down into oversold territory AND a higher-timeframe EMA cross confirms the larger trend is up. Four safety orders form a pure-price deviation ladder. Exit is a tight Take Profit with trailing, OR a hard Stop Loss, OR a forced close after a maximum holding period.
- Single base order with up to four safety orders, soft 1.05× size compounding.
- Dual confirmation entry: RSI(12) crossing down 35 on 5m AND EMA(50) > EMA(100) on 15m.
- Three exit paths: 1.0% Take Profit with 0.1% trailing, 9% hard Stop Loss, or forced market close after 3 days max hold.
- Default leverage 25× — per-trade realized risk ~7.17% of equity (inside the 5–10% band).
- Every entry, safety order, and exit emits a webhook-ready JSON alert payload for direct DCA Bot consumption.
🔷 Who is it for:
- Active traders comfortable with leveraged crypto perpetuals who want a systematic dip-buying engine inside confirmed uptrends.
- Bot operators who want a chart-driven signal source with per-event JSON ready for a DCA Bot configured for leveraged futures.
- Traders looking to combine momentum exhaustion (RSI dip) with trend confirmation (EMA stack) for higher-confidence entries.
- Portfolio operators who can absorb a 15–20% maximum drawdown in exchange for ~30% trailing returns over comparable periods.
🔷 How does it work:
Entry RSI Filter (Oversold Dip): A 5-minute RSI(12) is sampled via request.security with lookahead disabled. The dip gate fires when RSI crosses down through 35 — momentum has rolled over into oversold, which on a confirmed uptrend often marks a tactical bounce point.
EMA Trend Filter: A 15-minute EMA(50) and EMA(100) are sampled in parallel. The trend gate is satisfied only while Fast EMA > Slow EMA — the broader trend is up. When the EMA cross flips, the dip signal alone cannot open a trade.
Entry: When both gates align at host-bar close, a long position opens. Base order is configurable as Market (default) or Limit. With default 25× leverage, base margin × leverage = notional position size.
Safety Order Ladder: After base fill, the strategy monitors price deviation downward against the position. No additional gating — pure price ladder. The k-th safety order fires when close ≤ base entry × (1 − cumulative deviation), where cumulative deviation grows by the step multiplier (default 1.2): 1.00%, 2.20%, 3.64%, 5.37%. Each safety order's USDT margin grows by 1.05× — soft compounding.
Exit Priority: Three exit paths evaluated in order on each bar: (1) Stop Loss at 9% below average entry, (2) Maximum Hold timeout at 3 days from base entry, (3) Take Profit at 1% above average entry with 0.1% trailing — once price reaches the TP target, the position closes only after a 0.1% retrace from the in-favor peak.
🔷 Why it's unique:
- Two-Layer Confirmation: RSI(12) dip on 5m for entry timing, EMA(50/100) on 15m for trend bias. The two filters operate on different scales — momentum exhaustion alone cannot open a trade against a confirmed downtrend, and trend alignment alone cannot open a trade outside a tactical entry window.
- Three-Exit Architecture: Hard Stop Loss for tail-risk protection, Maximum Hold timeout for stuck trades that don't reach either bound, and Take Profit with trailing for letting winners run. Most DCA strategies use one or two exits; this one explicitly handles all three failure modes.
- Leverage-Aware Sizing: Base margin and leverage are independent inputs. Margin sets the per-trade capital commitment; leverage sets the notional exposure. Per-trade risk at SL = base + SO margins × SL% — bounded and predictable.
- DCA Bot Integration: Every event (base, SO 1–4, TP/SL/MaxHold close) emits a fully-formed JSON alert payload. Connect one alert to a DCA Bot's webhook URL and the strategy drives the bot end-to-end.
🔷 Considerations Before Using the Strategy:
Market & Timeframe: Defaults are calibrated for BYBIT:XMRUSDT perpetual on 15m. The dip-buying-in-uptrend logic is portable to other liquid crypto perpetuals with clear directional regimes, but the EMA periods and RSI thresholds should be reviewed before redeployment.
Leverage Warning: The default 25× leverage is aggressive. A 9% adverse price move at 25× leverage equals 225% of base margin — the Stop Loss closes the position at full margin loss before liquidation. The per-trade realized risk at SL is approximately 7.17% of equity at default base margin (60 USDT). Lower the leverage input or reduce base margin to dial down per-trade exposure.
Drawdown Profile: The backtest produced a 18.01% maximum equity drawdown over a 14-month sample with 779 closed trades. This is above TradingView's typical 5–10% per-trade band — but the figure reflects portfolio-level accumulation of losing trades across an adverse period, not single-trade risk. Per-trade risk remains inside the 5–10% band; the portfolio-level DD reflects the leveraged compounding and should be sized accordingly within a diversified strategy mix.
No SO Condition: Safety orders fire on pure price ladder with no momentum gate. This means averaging continues unconditionally as price drops, until either SL fires or the price reverses. The trade-off: higher average-entry quality if the dip continues, but greater unrealized loss exposure during sharp drops.
Maximum Hold Period: The 3-day forced close exists to release capital from stuck trades that haven't reached TP or SL. On a 15m chart, this is approximately 288 bars. Adjust the timeout to match your strategy rotation cadence.
Funding Rates (Perpetuals): Backtests do not account for perpetual funding rates. Sustained negative funding (shorts pay longs) improves live performance for this long strategy; sustained positive funding degrades it. Review the historical funding pattern before live deployment.
Demo Testing: Always demo-test before going live. Past results do not guarantee future performance, especially on leveraged strategies where small parameter changes materially affect risk.
🔷 STRATEGY PROPERTIES
Symbol: BYBIT:XMRUSDT.P (Perpetual)
Timeframe: 15M
Test Period: April 1, 2025 — May 26, 2026 (~14 months).
Initial Capital: 10,000 USDT.
Order Size per Trade: 60 USDT margin × 25× leverage = 1,500 USDT notional base + 4 safety orders at 1.05× progression.
Max Capital Deployed (Margin): ~318.6 USDT per trade across base + 4 SOs.
Max Realized Loss per Trade: ~717 USDT at full ladder + SL (~7.17% of equity).
Commission: 0.05% per trade.
Slippage: 3 ticks.
Leverage: 25× (configurable).
Margin for Long Positions: 100%.
Indicator Settings: Default Configuration.
Base Order: 60 USDT margin, Market by default (Limit toggle available).
Take Profit: 1.0% above average entry with 0.1% trailing.
Stop Loss: 9% below average entry (hard close).
Max Hold: 3 days (259,200 seconds) — forced market close.
Entry Filter: 5m RSI(12) Crossing Down 35 AND 15m EMA(50) > EMA(100).
Safety Orders: 4, Deviation 1.0%, Deviation Step 1.2×, Size Multiplier 1.05×.
Strategy: Long Only.
🔷 STRATEGY RESULTS
⚠️ Remember, past results do not guarantee future performance.
Net Profit: +3,078.80 USDT (+30.79%)
Max Equity Drawdown: 2,013.77 USDT (18.01%)
Total Closed Trades: 779
Percent Profitable: 74.07% (577 / 779)
Profit Factor: 1.313
🔷 How to Use It:
🔸 Adjust Settings: Open the strategy inputs and review the Base Margin, Leverage, entry filter (RSI level on 5m, EMA periods on 15m), the 4-SO ladder, and the three exit conditions. Defaults are calibrated for XMRUSDT.P 15m at 25× leverage — recalibrate per asset and per risk profile before deploying.
🔸 Results Review: Run a full-period backtest and confirm Max Drawdown stays inside your personal risk band. The 18% DD at default settings reflects 25× leverage — lower the leverage input to scale risk down proportionally. Validate the closed-trade count (≥ 100 minimum is a comfortable statistical floor).
🔸 Create alerts to trigger the DCA Bot: Add one alert on the strategy using "Any alert() function call". Paste the DCA Bot's webhook URL into the alert's Webhook field, and fill the Bot ID, Email Token, and Pair inputs on the script. The strategy will emit JSON payloads for entry, each safety order, and all three exit types — formatted for direct DCA Bot consumption.
🔷 INDICATOR SETTINGS
Base Order Margin (USDT): Margin per base trade. Notional = Margin × Leverage.
Leverage (×): Exchange leverage. Default 25× — adjust to match your account configuration.
Use LIMIT for Base: Toggle between Market (default) and Limit at bar close.
Max Safety Orders: Maximum number of safety orders per deal (default 4).
First SO Margin (USDT): USDT margin of the first safety order; subsequent SOs scale by the Size Multiplier.
Step to First SO (%): Distance from base entry at which SO1 becomes eligible.
Step Multiplier: Ladder factor that widens each subsequent deviation step.
Size Multiplier: Factor that grows each subsequent safety order's USDT margin.
Entry RSI Timeframe / Length / Level: Lower-timeframe RSI oversold-dip filter.
EMA Timeframe / Fast / Slow: Higher-timeframe trend confirmation filter.
Take Profit (%) / Trailing Deviation (%): TP target above avg entry and trailing buffer.
Stop Loss (%): Hard stop below avg entry.
Force Close After Max Hold / Max Hold (seconds): Timeout for forced market close.
DCA Bot Webhook: Bot ID, Email Token, and Pair fields injected into every alert payload.
Visualization: Toggle SO Ladder, Avg / TP / SL plot lines, fill labels, status table.
Brand Watermark: Configurable text, position, size, and transparency.
👨🏻💻💭 We hope this tool helps enhance your trading. Your feedback is invaluable, so feel free to share any suggestions for improvements or new features you'd like to see implemented.
__
The information and publications within the 3Commas TradingView account are not meant to be and do not constitute financial, investment, trading, or other types of advice or recommendations supplied or endorsed by 3Commas and any of the parties acting on behalf of 3Commas, including its employees, contractors, ambassadors, etc.
ストラテジー

インジケーター

Projected Crossover TrendProjected Crossover Trend is a directional trend-following indicator built around projected moving average crossover momentum and Market Direction Indicator (MDI) calculations.
Instead of waiting for a traditional moving average crossover, this indicator attempts to measure projected crossover momentum before the crossover fully develops. This helps identify directional shifts earlier while smoothing market noise through the MDI calculation.
Bullish Regime:
• MDI is positive
• Price is above the slow-length reference close
Bearish Regime:
• MDI is negative
• Price is below the slow-length reference close
インジケーター

SMC + Wyckoff Probability Engine v1.1Trade when set up score is A/A+
Set timeframe to D, HTF to Week
インジケーター
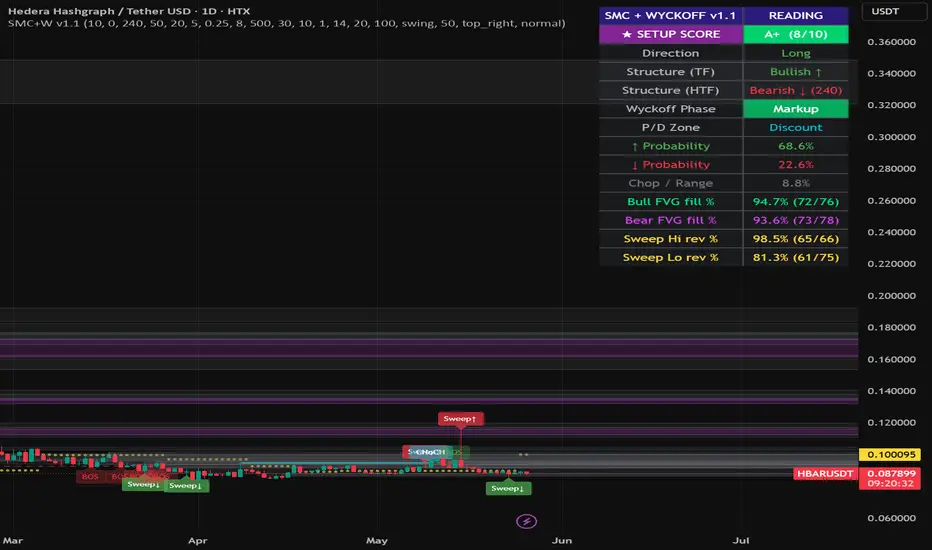
EMA TUNNEL[jackieee]EMA TUNNEL is a multi-timeframe EMA band indicator based on the Vegas Tunnel concept. It uses three main EMA groups to form trend bands, helping traders identify broader market direction, dynamic support and resistance zones, and potential trend continuation or reversal areas. The indicator also allows the tunnel to be calculated from a selected base timeframe, such as 1D, while displayed on any chart timeframe.
インジケーター

EMA-SMA-WMA-DEMA-VWMA 20-50-100-150-200 This indicator brings together the 5 most commonly used moving average types (EMA, SMA, WMA, DEMA, VWMA) and their critical periods (20, 50, 100, 150, 200) in technical analysis under one roof.
The presence of 25 different lines on the chart may seem complex at first glance, so I have summarized the strategic usage guide below:
1. Differences Between Moving Average Types
Knowing which average to use when allows you to understand the "speed" of the price:
SMA (Simple): The slowest moving average, most closely watched by institutional investors (especially the 200 SMA). Provides reliable support/resistance.
EMA (Exponential): Gives more weight to recent price movements. Signals trend reversals faster than SMA.
WMA (Weighted): Similar to EMA but more sensitive to price changes.
DEMA (Double Exponential): Reduces lag to almost zero. Suitable for very fast scalping trades.
VWMA (Volume Weighted): Blends price with volume. If the VWMA also steepens as the price rises, it means that this rise is supported by "real volume".
Bu indikatör, teknik analizde en çok kullanılan 5 farklı hareketli ortalama türünü (EMA, SMA, WMA, DEMA, VWMA) ve bunların kritik periyotlarını (20, 50, 100, 150, 200) tek bir çatıda topluyor.
Grafiğinde 25 farklı çizgi olması ilk bakışta karmaşık gelebilir, bu yüzden stratejik kullanım rehberini aşağıda özetledim:
1. Hareketli Ortalama Türleri Arasındaki Farklar
Hangi ortalamayı ne zaman kullanacağını bilmek, fiyatın "hızını" anlamanı sağlar:
SMA (Basit): En ağır hareket eden, kurumsal yatırımcıların (özellikle 200 SMA) en çok dikkat ettiği ortalamadır. Güvenilir destek/direnç sağlar.
EMA (Üssel): Son fiyat hareketlerine daha fazla ağırlık verir. Trend dönüşlerini SMA'dan daha hızlı sinyalleşir.
WMA (Ağırlıklı): EMA'ya benzer ama fiyat değişimlerine karşı daha hassastır.
DEMA (Çift Üssel): Gecikmeyi (lag) neredeyse sıfıra indirir. Çok hızlı scalping işlemleri için uygundur.
VWMA (Hacim Ağırlıklı): Fiyatı hacimle harmanlar. Eğer fiyat yükselirken VWMA da dikleşiyorsa, bu yükselişin "gerçek hacimle" desteklendiğini anlarız.
インジケーター

PSOL 02 Keltner BreakoutPSOL 02 Keltner Breakout — TradingView Community Description
PSOL 02 Keltner Breakout is a Breakout strategy designed for VN30F1M (Vietnamese Stock Index Futures), built with Pine Script v5.
📌 Indicators used: Keltner Channel (EMA + ATR-based bands) + SMA(200) Trend Filter
📐 Entry Rules:
Long: Close crosses above the Upper Keltner Band → bullish breakout confirmed
Short: Close crosses below the Lower Keltner Band → bearish breakout confirmed
Entry executes at the open of the next bar after signal confirmation at close.
🚪 Exit Rules:
Stop Loss: Fixed points from entry price (default: 10 points)
Take Profit: Fixed points from entry price (default: 20 points) — optional, can be disabled
Reverse: Position flips automatically when an opposite breakout signal fires with full entry conditions met
End of Session: All positions closed automatically when the session ends
⏰ Time Filter:
Built-in session filter to avoid ATO (8:45–9:00) and ATC (14:30–15:00) periods.
Default session: 9:00 – 14:30. Start/end time fully configurable via inputs.
🔧 Trend Filter (optional):
SMA(200) slope filter — Long signals allowed only when SMA is rising (Bull), Short signals only when SMA is falling (Bear). Can be disabled for both-direction trading.
📍 Recommended for: VN30F1M intraday traders
📊 Note: Keltner Channel is an overlay indicator — it displays directly on the price chart. No additional indicator panel needed.
🔗 Community: zalo.me
ストラテジー
