インジケーター

インジケーター

インジケーター

インジケーター

Volatility Contraction Pattern [AGPro Series]Volatility Contraction Pattern
🧠 Core Idea
Is volatility contracting into a tighter and tighter base that is coiling toward a breakout pivot, and how high-quality is that setup?
This script is built to answer that one question with structure instead of guesswork.
📌 Overview / What It Does
Volatility Contraction Pattern is a breakout-readiness decision engine built around the classic VCP structure: a base where price pulls back in successive, progressively shallower contractions, coiling into a breakout pivot. It reads the swing structure as a zigzag, measures each contraction leg, and counts how many recent legs are tightening into the present.
From that it builds a single 0-100 readiness score by weighing four things: how many successive contractions are present, how tight the latest contraction is relative to ATR, whether the base sits inside a constructive trend, and whether volume is drying up into the base. It then marks the pivot breakout level at the most recent swing high, a tight invalidation at the latest contraction low, a measured-move target projected from the base height, and a clear next-action state.
It does NOT predict price, generate buy or sell signals, or automate trades. It organizes the base-and-breakout picture into a structured, scored read so a contraction setup is easier to recognize and plan around. Every output is analytical context, not a recommendation.
🎯 Purpose & Design Philosophy
Most breakout tools react to a single breakout bar after it prints, or they mark a generic low-volatility squeeze and leave the rest to interpretation. Far fewer frame the multi-contraction base as a staged, scored readiness with a defined pivot and a tight, structural risk reference.
This engine was built to fill that gap. It is for the patient trader who prefers to wait for a proper base to form rather than chasing every move, and who values a tight, well-defined risk reference. It supports a base-and-breakout mindset: let the contraction sequence develop, read how ready and how tight it is, mark the pivot and the invalidation, and let broader market context confirm or deny the idea. The aim is structured patience, not a shortcut around it.
⚡ Why This Script Is Different
Most tools mark a single squeeze state or fire the instant a breakout bar appears.
This script does NOT call the breakout, does NOT fire trade signals, and does NOT treat one tight bar as a setup.
Instead, it stages the whole contraction sequence. It counts successive tightening legs, measures current tightness in ATR, and resolves the base into a 0-100 readiness score with a pivot breakout level, a tight invalidation at the latest contraction low, and a measured-move target. The result is a calm, structured base read with a defined risk reference, rather than a backward-looking alert or a single-bar trigger.
⚙️ Methodology
1. Context Detection
An ATR baseline and an EMA trend backbone with a slope check describe the current environment.
2. Structure Mapping
Swing highs and lows are tracked as an alternating zigzag. The amplitude of each recent leg is measured to describe the contraction sequence.
3. Contraction Evaluation
The engine counts how many successive legs are tightening into the present, measures the latest contraction tightness against ATR, checks trend context, and reads volume dry-up. These combine into a single 0-100 quality score, and the base resolves into a state.
4. Visual Output
The base zone, pivot breakout level, tight invalidation, measured-move target, a centered readiness badge, and moderate state labels are rendered cleanly on the chart and in the panel.
🗺️ How to Read the Chart
- Base zone: a shaded box spanning the contraction base from its low to its high, tinted by the current state.
- Pivot line and tag: the breakout level at the most recent swing high, the trigger reference.
- Invalidation line and tag: the latest contraction low, the tight structural risk reference.
- Target line and tag: the measured-move objective projected from the base height above the pivot.
- Readiness badge: centered inside the base zone, showing the state and its 0-100 score.
- State labels: compact markers when the pattern enters Pivot Ready, Breakout, or Reset.
- Panel: a fixed readout of state, quality score, pivot, target, contractions and tightness, invalidation, and action.
🚦 Signals & States
- No Base: not enough structure to define a contraction base.
- Base Forming: a base is developing but not yet tight or built enough.
- Coiling: successive contractions are tightening and readiness is building.
- Pivot Ready: the base is tight and near the pivot, with a qualifying score.
- Breakout: price has moved beyond the pivot level.
- Reset: the base was invalidated below its risk reference.
These are interpretive states, not instructions. Pivot Ready does not mean buy; it means the base is tight and near its trigger in the current context.
🔔 Alerts Logic
Three optional alerts are available:
- Pivot Ready: triggers when the base becomes pivot-ready.
- Breakout: triggers when price moves beyond the pivot.
- Pattern Reset: triggers when the base is invalidated.
Alerts are attention markers that point you back to the chart for context. They are not trade instructions and carry no guarantee of any outcome.
🧩 Confluence Logic
The score is itself a confluence read. When the contraction count, the latest-leg tightness, the trend context, and the volume dry-up all agree, the score is higher and the base is more pronounced. When they disagree, the score stays moderate and the state often remains Base Forming, which is information in itself: the base is not yet a clean contraction.
📊 When to Use
- After a strong move, when price begins to base and contract rather than trend.
- In constructive consolidations where pullbacks are getting shallower.
- As a continuation-base overlay alongside your own structure and risk framework.
- On liquid symbols with enough swing history for the structure to form.
⚠️ When NOT to Use
- In choppy markets with no clear base structure.
- In very low-liquidity symbols or sessions, where swings are unreliable.
- In extremely noisy conditions, where levels are violated erratically.
- As a standalone entry trigger, or in isolation from market context and risk.
🎛️ Key Inputs
- Swing Strength and Swing Memory: how swings are detected and how many are retained.
- Base Swing Window: how many recent swings define the active base.
- Trend Backbone EMA and Slope Bars: the trend-context weighting.
- Use Volume Dry-Up and its windows: whether and how decreasing volume contributes.
- Tightness Scale: the ATR reference for scoring contraction tightness.
- Pivot-Ready Score, Pivot Proximity, Ready Tightness: thresholds that define a pivot-ready base.
- Visual, label, and panel controls: base zone, pivot, target and invalidation lines and tags, label density, panel location, theme, and font size.
🖥️ Interface & Visual Design
The panel is the primary readout, leading with the state and 0-100 score, then pivot, target, contractions and tightness, invalidation, and a concise action line. On the chart, the base zone anchors the structure, the pivot and invalidation give the trigger and the tight risk, and the measured-move target frames the objective. The readiness badge sits centered inside the base so the read is tied to the structure. Labels are kept moderate and fire only on state transitions so the chart stays clean. Panel location, theme, and font size are adjustable; the panel is shown by default for readability.
🧪 Practical Usage Workflow
1. Read the panel: note the state and the quality score.
2. Check contractions and tightness: how many tightening legs, and how tight now.
3. Watch the pivot: the breakout reference at the top of the base.
4. Note the invalidation and target: the tight risk reference and the measured objective.
5. Confirm with your own market structure, higher-timeframe context, and risk framework before any decision.
🔍 Interpretation Guidelines
Think of the read as a staged base readiness, not a forecast. A higher score means more successive contractions, tighter current price action, and better trend and volume context. A moderate score or a Base Forming state means the base is not yet clean and patience is warranted. The invalidation is a structural reference, not a hard line. Always interpret the base inside the broader market context rather than in isolation.
🚫 What This Script Is NOT
- It is NOT a prediction engine and does not forecast price direction.
- It is NOT financial advice or a recommendation to buy or sell.
- It is NOT an automated trading system.
- It does NOT produce guaranteed signals or outcomes.
⚠️ Limitations & Transparency
Outputs depend on detected swing structure and may differ across timeframes and symbols. Volatility, liquidity, and changing market conditions affect how bases form and how they resolve. A base can break out, fail, or simply drift; the engine describes current structure and cannot know the future. Any pivot can be exceeded or fail to be reached, and any base can be invalidated.
🧠 Market Context Notes
Bases tend to form after directional moves, as participants pause and pullbacks get shallower. Classic contraction structure pairs successively tighter pullbacks with drying volume, often inside a constructive trend. This engine encodes that logic into a single staged read, but broader market context always has the final word, and a tight base is a condition, not a promise.
🧾 Use Case Examples
- After a strong advance, price bases with two or three progressively tighter pullbacks: the engine moves from Base Forming to Coiling and may reach Pivot Ready near the pivot.
- Volume dries up into a tight base inside an uptrend: the quality score rises as contraction, tightness, trend, and volume align.
- Price breaks below the latest contraction low: the engine reports Reset, signaling the contraction structure has invalidated.
🧱 System Philosophy
This tool reflects the AGPro Series approach: convert a familiar but messy concept into a calm, structured, decision-support read. A contraction base is easy to misjudge by eye; the value is in staging it into an honest, scored read with a defined risk reference, while respecting the trader's own judgment rather than replacing it.
🔐 Non-Promise Statement
This script makes no promise of profit, accuracy, or any specific result. It is an analytical and organizational tool. No certainty is offered or implied.
📉 Risk Disclosure
Trading involves substantial risk, and most participants can lose money. This script is provided for educational and analytical purposes only and does not constitute financial advice. All decisions, positions, and outcomes remain entirely your own responsibility. Always manage risk and trade within your own plan.
📚 Educational Note
Used as intended, the engine can sharpen how you think about contraction bases: how many tightening legs are present, how tight the base has become, where the pivot and the risk sit, and what would invalidate the structure. Treat it as a lens for structured analysis, and keep building your own market understanding alongside it.
インジケーター

Volume Delta ProfileVolume Delta Profile
The Volume Delta Profile is an overlay indicator that builds a horizontal volume delta distribution directly on the price chart, similar to a Market Profile or Volume Profile but using net delta (buying pressure minus selling pressure) as the core metric instead of raw traded volume.
━━━━━━━━━━━━━━━━━━━━━━━━━━━━━━━━━━━━━━━━
WHAT IS VOLUME DELTA?
━━━━━━━━━━━━━━━━━━━━━━━━━━━━━━━━━━━━━━━━
Volume delta measures the difference between aggressive buying volume (market buy orders hitting the ask) and aggressive selling volume (market sell orders hitting the bid) within a given candle. A positive delta means buyers were more aggressive during that candle. A negative delta means sellers were more aggressive.
This indicator uses TradingView's native ta.requestVolumeDelta() function, which reconstructs delta by scanning a lower timeframe (automatically selected or manually configured) to approximate the split between up-volume and down-volume for each candle.
━━━━━━━━━━━━━━━━━━━━━━━━━━━━━━━━━━━━━━━━
HOW IT WORKS
━━━━━━━━━━━━━━━━━━━━━━━━━━━━━━━━━━━━━━━━
The indicator scans a configurable number of historical bars (default: 500) and for each bar assigns its volume delta to a price level based on the closing price of that bar. Price levels are divided into equally spaced buckets across the high-to-low range of the lookback period.
Positive delta (net buying) accumulates in the bullish bucket of that price level.
Negative delta (net selling) accumulates in the bearish bucket of that price level.
The result is a horizontal bar chart displayed to the right of the last candle, where each row represents a price level and the width of the bar represents the total delta activity at that level. The color of each bar reflects which side dominated:
• Teal bars → net buying pressure dominated at that price level
• Pink/red bars → net selling pressure dominated at that price level
The Point of Control (POC) is marked as a solid horizontal line extending 50 bars to the left, highlighting the price level where the highest total delta activity occurred across the entire lookback period.
━━━━━━━━━━━━━━━━━━━━━━━━━━━━━━━━━━━━━━━━
COMPONENTS
━━━━━━━━━━━━━━━━━━━━━━━━━━━━━━━━━━━━━━━━
1. Delta Profile (horizontal bars)
A visual distribution of accumulated volume delta across price levels. Each bar's width is proportional to the total delta activity at that level relative to the most active level. Bars are color-coded by dominant side (buyers vs sellers).
2. Point of Control (POC)
The price level with the highest total delta activity in the lookback window. Displayed as a solid horizontal line extending 50 bars to the left of the current bar. This is the price where the most aggressive order flow occurred — institutional interest tends to concentrate here.
━━━━━━━━━━━━━━━━━━━━━━━━━━━━━━━━━━━━━━━━
SETTINGS
━━━━━━━━━━━━━━━━━━━━━━━━━━━━━━━━━━━━━━━━
• Lookback bars (default 500): Number of historical candles to include in the profile. More bars give a broader context; fewer bars focus on recent activity.
• Bar width (default 20): Visual width in pixels of the widest bar in the profile. Adjust for chart readability.
• Price levels (default 50): Number of horizontal buckets the price range is divided into. More levels give finer granularity; fewer levels give a smoother, broader view.
• Positive delta color (default teal): Color for price levels where buying pressure dominated.
• Negative delta color (default pink): Color for price levels where selling pressure dominated.
• POC color (default black): Color of the Point of Control line.
• Profile offset (default 10): Horizontal distance in bars between the last candle and the left edge of the profile. Increase to avoid overlap with live price action.
• Custom timeframe: Override the automatic lower timeframe used for delta reconstruction. Higher timeframes load more history but reduce precision.
━━━━━━━━━━━━━━━━━━━━━━━━━━━━━━━━━━━━━━━━
HOW TO INTERPRET IT
━━━━━━━━━━━━━━━━━━━━━━━━━━━━━━━━━━━━━━━━
DOMINANT COLOR ZONES
Large teal zones indicate price areas where institutional buyers were consistently aggressive. These levels tend to act as support — if price returns to them, buyers are likely to defend the level. Large pink zones indicate areas of consistent selling aggression, which tend to act as resistance or liquidity targets for short-side participants.
PROFILE SHAPE
A profile with a clear peak (narrow, tall distribution) suggests price spent most of its time and order flow at a specific level — strong agreement on value. A wide, flat profile suggests price moved across a broad range without clear absorption at any single level.
POINT OF CONTROL (POC)
The POC is the single most important level in the profile. It represents where the maximum institutional order flow occurred. Price has a strong tendency to gravitate back toward the POC after extended moves away from it, making it a high-probability mean-reversion target. It also acts as a decisive level: a clean break and hold above a teal POC confirms bullish institutional commitment; a rejection at a pink POC confirms continued distribution.
DIVERGENCE BETWEEN COLOR AND PRICE MOVEMENT
If price fell sharply through a level but the profile shows teal (net buying) at that level, it suggests absorption — institutions were buying the selling pressure. This is often a precursor to a reversal. Conversely, if price rose through a level but the profile shows pink, distribution was occurring into the rally.
━━━━━━━━━━━━━━━━━━━━━━━━━━━━━━━━━━━━━━━━
HOW TO USE IT
━━━━━━━━━━━━━━━━━━━━━━━━━━━━━━━━━━━━━━━━
1. IDENTIFY THE VALUE AREA
Look for the widest bars in the profile — these are the price levels with the most delta activity. The market considers these levels "fair value." Price tends to spend more time here and frequently returns to these zones after deviation.
2. USE THE POC AS A MAGNET
If price is trading significantly above or below the POC, there is a structural tendency to return to it. The POC acts as a mean-reversion target, especially in range-bound or post-impulse conditions.
3. READ THE COLOR FOR BIAS
Before entering a trade, check the delta color at the relevant support or resistance level. A teal zone below current price strengthens a long bias — institutions were buying there. A pink zone above current price strengthens a short bias — institutions were selling there.
4. SPOT ABSORPTION
Large teal bars at price lows or large pink bars at price highs are signs of institutional absorption. These are the exact footprints of Wyckoff accumulation and distribution phases — smart money absorbing retail order flow before the next directional move.
5. COMBINE WITH STRUCTURE
Use this indicator alongside your market structure analysis. A key structural level (support, resistance, order block) that coincides with a high-delta POC or dominant color zone has significantly higher probability of holding or acting as a reversal point.
━━━━━━━━━━━━━━━━━━━━━━━━━━━━━━━━━━━━━━━━
NOTES
━━━━━━━━━━━━━━━━━━━━━━━━━━━━━━━━━━━━━━━━
• Delta data requires a data provider that supplies volume. The indicator will throw a runtime error if volume data is unavailable for the selected symbol.
• The profile updates on bar close and on the last real-time bar to keep the display current without excessive recalculation.
• Works on any timeframe and any instrument with volume data: forex, indices, crypto, commodities, equities.
• For best results on higher timeframes (daily, weekly), enable the custom timeframe option and select a higher sub-timeframe (e.g., "60") to ensure sufficient historical delta data is available.
インジケーター

インジケーター

Momentum Leader ATR Risk MapMomentum Leader ATR Risk Map is a position-management indicator designed to help traders visualize where a leading stock is trading relative to its 50-period SMA and ATR-based extension levels.
The goal is not to generate automatic buy or sell signals. Instead, this tool provides a structured risk map for momentum leaders by combining:
• ATR extension from a configurable SMA baseline
• Positive extension bands for profit-taking and risk management
• Negative extension bands for pullback, add-zone, and damage-control reference levels
• Relative strength scoring versus a benchmark such as SPY
• SMA trend status
• Optional liquidity, sector RS, and industry RS filters
• Nearest upside and downside map levels shown directly in the table
By default, the indicator uses a Daily anchor and 50-period SMA baseline, making it suitable for swing trading and longer-term position management in momentum leaders. A 24-hour / 1440-minute anchor is also available for users who prefer to evaluate instruments with extended-hours or near-24-hour trading behavior.
Core Risk Map Levels:
Positive Extension Zones:
• +2.95x ATR: High-RS leader zone
• +4.56x ATR: Super momentum zone
• +5.27x ATR: Approximate 2σ risk zone
• +7.83x ATR: Approximate 3σ profit zone
• +10.00x ATR: Extreme / trail-only zone
Negative Extension Zones:
• -1.00x ATR: Pullback
• -2.00x ATR: Add zone
• -3.00x ATR: Deep pullback
• -4.56x ATR: Damage control
• -5.27x ATR: Washout / reclaim-needed zone
The table is designed to answer a few practical questions quickly:
• Is the stock still acting like a leader?
• Is price extended, normal, or damaged relative to the SMA/ATR map?
• Is the SMA trend still constructive?
• Is relative strength still intact across multiple lookback windows?
• Where is the nearest upside ATR map level?
• Where is the nearest downside ATR map level?
Relative Strength Logic:
The RS Score compares the current symbol against a user-selected benchmark over 21, 63, 126, and 252 anchor bars. A score of 4 of 4 means the symbol is outperforming the benchmark across all four lookback windows.
Optional Advanced Inputs:
The indicator includes optional sector and industry RS inputs for users who want to manually compare the stock against relevant ETFs such as XLK, SMH, IGV, XBI, XLE, XLF, or other sector/industry proxies. These are turned off by default to keep the tool frictionless.
A liquidity filter is also available, but it is turned off by default so the indicator can remain focused on the risk map itself.
Credit and Inspiration:
This indicator was inspired by concepts shared by several market educators and traders:
• Jeff Sun / @jfsrev
x.com
• @i_manage_risk
x.com
• StratLab / @StratLaboratory
x.com
Their publicly shared work on relative strength, momentum leadership, ATR extension frameworks, risk management, and scaling into or out of leaders helped shape the conceptual foundation for this tool.
This script is an independent implementation. It is not affiliated with, sponsored by, or endorsed by Jeff Sun, @i_manage_risk, StratLab, or @StratLaboratory, and it is not intended to replicate their complete methodologies.
Suggested Use:
This indicator is best used as a position-management overlay for stocks that have already been identified as potential leaders through a separate screening process. It can help define areas where the stock may be:
• Acting normally within a leadership trend
• Becoming extended into profit-taking zones
• Pulling back toward constructive support
• Losing momentum or entering damage-control territory
Important Notes:
ATR extension levels are reference zones, not guaranteed targets or support/resistance levels. A stock can remain extended for longer than expected, especially during strong momentum regimes. Conversely, deep pullbacks can signal deterioration rather than opportunity if leadership and trend structure are no longer intact.
Use this tool alongside broader market context, earnings risk, volume behavior, trend structure, and personal risk-management rules.
This indicator is for educational and informational purposes only and does not constitute financial advice. インジケーター

インジケーター

インジケーター

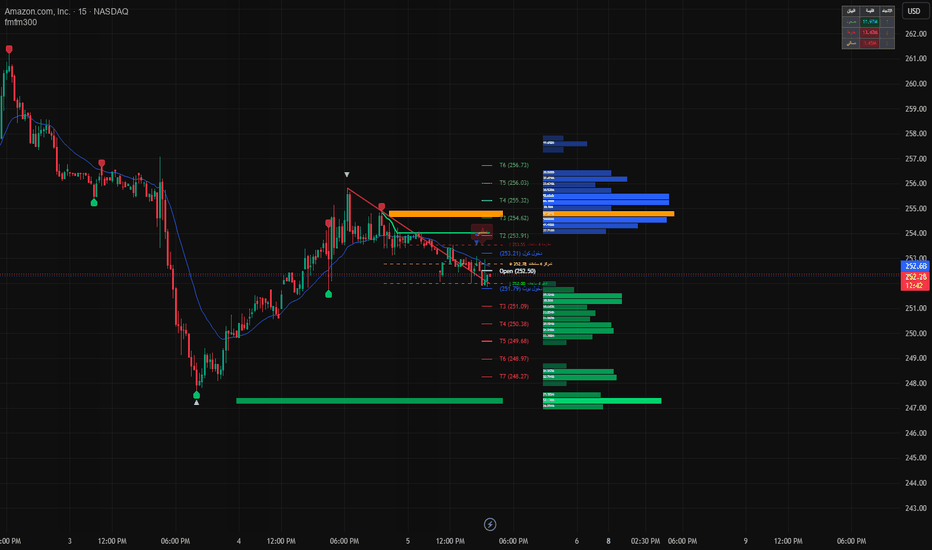
fmfm300 Certainly! Here's a detailed explanation of what this Pine Script indicator does, written in English so you can use it in TradingView.
Overview: "fmfm300" Indicator
This is a comprehensive multi-strategy trading indicator that combines 6+ different trading concepts into one tool. It's designed for intraday to swing trading on any timeframe.
Main Components (What it shows):
1. Supertrend + EMA (Trend Following)
Supertrend (ATR 10, Factor 3.0) - Identifies trend direction
EMA 20 - Additional trend confirmation
Labels show "إيجابي" (Bullish) or "سلبي" (Bearish) when trend changes
Color zones: Light green (bullish), Light red (bearish), Darker colors for sideways
2. Braid Filter (Trend Strength)
Compares 3 moving averages (Periods: 3, 7, 14)
Green = Bullish alignment (MA1 > MA2, sufficient separation)
Red = Bearish alignment (MA2 > MA1, sufficient separation)
Gray = Sideways/weak trend
Uses ATR to filter out false signals (minimum separation %)
3. Liquidity HeatMap (Volume Profile)
Shows where volume accumulated at specific price levels
Green boxes = Buy-side liquidity (price below current)
Blue boxes = Sell-side liquidity (price above current)
Orange boxes = Point of Control (highest volume node)
Helps identify support/resistance zones and potential liquidity grabs
4. Pivot Points (Support/Resistance)
Red "▼" labels = Major Pivot Highs (resistance)
Blue "▲" labels = Major Pivot Lows (support)
Temporary pivots (darker blue with "⚠ Subject to repaint") - shorter-term levels
5. Supply/Demand Indicator (Second Indicator)
Displays a text summary with:
🟢 = Green candle (Demand > Supply)
🔴 = Red candle (Supply > Demand)
⚪ = Doji
RSI background: Green (RSI > 55 = bullish), Red (RSI < 45 = bearish)
Demand/Supply percentages based on volume-weighted price movement
6. Data Table (Multi-Timeframe Volume Analysis)
Shows cumulative volume from 3 timeframes (1H, 15min, 5min):
Buy volume (Green) - Volume from bullish candles
Sell volume (Red) - Volume from bearish candles
Net result (Green/Red) - Difference between buy and sell volume
Formatting: K (thousands), M (millions), B (billions)
7. Auto-Fibonacci (HTF Targets)
Calculates standard deviation-based levels from higher timeframe
Shows target levels (T1, T2, T3, etc.) above/below current price
Dashed lines with price labels
Can mirror levels for both directions
Alert when price crosses these levels
8. Daily Support/Resistance (HTF Levels)
Shows previous period's High, Low, and Midpoint from selected timeframe
Options: 60min, 240min (4H), or Daily
Red line = Resistance, Green line = Support, Yellow line = Midpoint
Labels show level type and price
9. Fair Value Gaps (FVG) / Liquidity Zones
Red boxes = Bearish FVGs (price gaps down)
Green boxes = Bullish FVGs (price gaps up)
"سيولة" (Liquidity) labels inside boxes
Tracks when liquidity is taken (✓ تم سحب السيولة)
Can show closest boxes to current price only
10. Order Blocks (Supply/Demand Zones)
Green boxes = Demand zones (bullish order blocks)
Red boxes = Supply zones (bearish order blocks)
"▲" signal appears when price enters demand zone
"▼" signal appears when price enters supply zone
Uses zigzag pattern to identify significant swing points
Alerts when price reaches these zones
11. Dynamic VWAP
Adaptive VWAP that changes with volatility
Green line = Bullish VWAP (after higher low)
Red line = Bearish VWAP (after lower high)
Labels at swing points show where VWAP resets
12. Trend Lines
Automatic trendlines drawn from pivot highs/lows
Teal lines = Bullish trendlines (upward slope)
Red lines = Bearish trendlines (downward slope)
How to Use in TradingView:
Best for:
Intraday trading (5min, 15min, 1H, 4H)
Swing trading (Daily timeframe)
Cryptocurrency, Forex, Stocks, Indices
Trading Signals (Buy):
Supertrend bullish (light green background)
Braid filter green
Price near demand zone (green box with "▲")
RSI > 55 (from second indicator)
Net volume positive (green in data table)
Price above dynamic VWAP (green line)
Trading Signals (Sell):
Supertrend bearish (light red background)
Braid filter red
Price near supply zone (red box with "▼")
RSI < 45
Net volume negative (red in data table)
Price below dynamic VWAP (red line)
Key Settings to Adjust:
Setting Purpose Recommended
ATR Period Supertrend sensitivity 10 (default)
Factor Supertrend distance 3.0 (default)
PipsMinSepPercent Braid filter strength 40%
Calculated Bars HeatMap history 100
Pivot Length Major pivot sensitivity 20
Fibo Period HTF target calculation 85
الحد الأدنى للفصل Minimum separation for trend 40%
Limitations to Know:
Temporary pivots repaint (⚠ warning shown)
HeatMap only draws on the last bar (performance optimized)
Some calculations use lookahead=on (may repaint in real-time)
Heavy indicator - may slow down TradingView on low-end devices
Best used on non-intraday timeframes (15min+) for accuracy
Summary:
This indicator is an all-in-one trading dashboard that combines:
Trend following (Supertrend + Braid)
Support/Resistance (Pivots + Daily levels + Order blocks)
Volume analysis (HeatMap + Multi-TF table + Supply/Demand)
Target levels (Auto-Fibonacci)
Liquidity concepts (FVG + Order blocks)
Dynamic pricing (VWAP)
Best strategy: Use the confluence of 3+ signals before entering a trade. Don't rely on any single component alone.
The Arabic labels indicate this was designed for Arabic-speaking traders, but the visual signals are universal (colors, boxes, lines). The combinedText at the top shows the overall market state (صاعد = bullish, هابط = bearish, عرضي = sideways) インジケーター
Apex Signals & Overlays + Quant Rating( by Sammy JR)## 🚀 Institutional Signal Suite
**Institutional Signal Suite** is a powerful all-in-one trading indicator designed to help traders identify high-probability buying and selling opportunities across stocks, ETFs, indices, cryptocurrencies, forex, and commodities.
Built using a combination of trend analysis, momentum filtering, market structure, dynamic support/resistance zones, volume profiling, and smart-money-inspired logic, this indicator aims to simplify market analysis into clear, actionable signals.
### 🔥 Key Features
✅ **Buy & Sell Signals**
* Automatically identifies potential trend reversals and continuation opportunities.
* Signals are filtered to reduce noise and avoid low-quality setups.
✅ **AI-Style Market Rating Engine**
* Continuously evaluates market conditions and assigns a bullish or bearish bias.
* Provides an easy-to-read overall market verdict.
✅ **Dynamic Support & Resistance Zones**
* Automatically plots important supply and demand areas.
* Highlights potential reversal and breakout levels.
✅ **Trend Detection System**
* Identifies the dominant market trend.
* Helps traders stay aligned with higher-probability directional moves.
✅ **Risk Management Levels**
* Optional stop-loss and trade management levels.
* Helps improve discipline and consistency.
✅ **Volume Profile Integration**
* Displays key high-volume areas where institutional activity may be concentrated.
* Useful for identifying support, resistance, and value zones.
✅ **Multi-Asset Compatible**
* Works on:
* Stocks
* ETFs
* Crypto
* Forex
* Commodities
* Indices
### 📈 How to Use
**Buy Signals**
* Look for BUY labels appearing near demand/support zones.
* Stronger setups occur when the overall rating turns bullish and price trades above the trend filter.
**Sell Signals**
* Look for SELL labels appearing near supply/resistance zones.
* Higher-quality setups occur when the rating turns bearish and price trades below the trend filter.
**Trend Following**
* Focus on signals that align with the prevailing trend for better probability.
### ⚠️ Important Notes
* This indicator is designed as a decision-support tool and should not be used as financial advice.
* No indicator can predict markets with 100% accuracy.
* Always combine signals with proper risk management and your own market analysis.
### 🎯 Best Timeframes
Works across multiple timeframes, but generally performs best on:
* 4H
* Daily
* Weekly
### 💡 Ideal For
* Swing Traders
* Position Traders
* Day Traders
* Long-Term Investors
* Portfolio Managers
---
**Institutional Signal Suite helps transform complex market data into clear trading decisions by combining trend, momentum, volume, and market structure into one easy-to-use framework.** 📊🚀
インジケーター

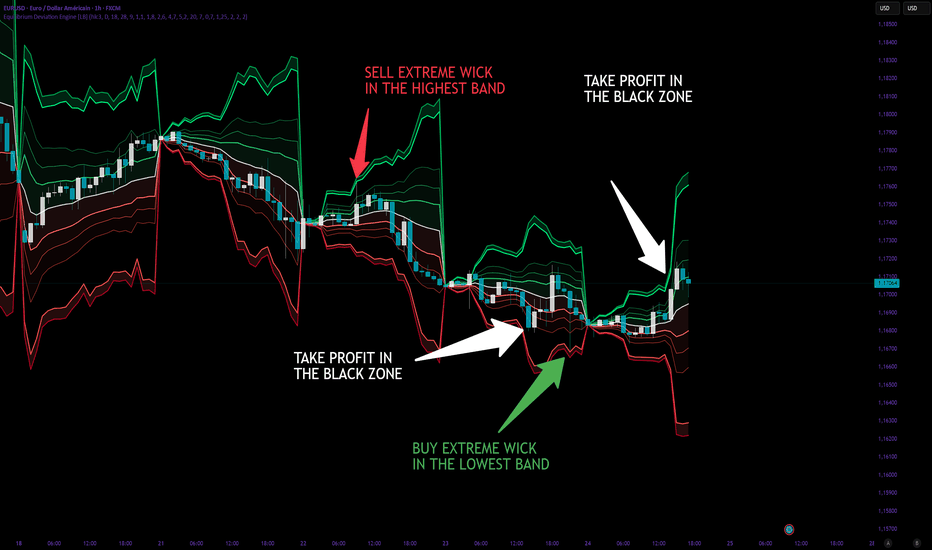
Equilibrium Deviation Engine [LB]
Concept
The Equilibrium Deviation Engine is a session-resetting, volume-weighted equilibrium model that builds a dynamic fair value basis from accumulated price and volume since the last anchor point (daily by default). Around this basis, it constructs multiple deviation bands and an independent extreme contrarian channel whose width varies inversely with short-term volatility — expanding during quiet markets and contracting during turbulent ones.
Mathematical Foundation
At each new session (e.g., daily open), the engine resets three accumulators and recalculates them bar by bar :
PV = SUM(Price * Volume)
V = SUM(Volume)
P2V = SUM(Price^2 * Volume)
The equilibrium basis is the volume-weighted average price since reset :
Basis = PV / V
The standard deviation of price around this basis is derived from the variance :
Var = max( (P2V / V) - Basis^2 , 0 )
Dev = sqrt(Var)
Three main bands are then computed by applying adaptive multipliers to this deviation. The adaptation uses two independent weights :
TWAP Weight — compares the basis to a hidden TWAP. The larger the gap relative to the deviation, the more the bands widen, capturing potential mean-reversion targets.
HV Weight — compares current historical volatility (HV) to its own smoothed baseline. When HV expands, bands widen ; when HV contracts, bands narrow.
The final band width for level k is :
D_k = Dev * Mult_k * TWAP_Weight * HV_Weight
The Extreme Contrarian Channel
A separate channel is built using an inverse volatility weight. Instead of expanding with rising HV, it contracts :
InvWeight = clamp( 1 / (HV_contrarian / HV_contrarian_baseline) , min, max )
This creates a structural envelope that is widest during low-volatility regimes (where price tends to range) and tightens during high-volatility regimes (where price breaks through normal boundaries). The inner and outer levels use user-defined sigma multipliers.
What Problem Does It Solve ?
Traditional deviation bands (Bollinger, Keltner, VWAP bands) use fixed lookback windows and a single volatility metric. They do not reset at session boundaries, nor do they distinguish between different volatility regimes for mean-reversion versus breakout scenarios. The Equilibrium Deviation Engine solves this by :
- Resetting accumulators at each session (e.g., daily), producing a true volume-weighted equilibrium for the current period.
- Adapting band width to both the TWAP gap (directional drift) and HV regime (market excitement).
- Adding a separate contrarian channel using inverse volatility, specifically designed to identify exhaustion zones where low volatility precedes expansion, or where extreme HV signals climax conditions.
How To Interpret
Basis line (white) — the real-time volume-weighted fair value for the current session. Price above basis signals session bullishness ; price below signals session bearishness.
Deviation bands 1, 2, 3 — graduated zones of overextension from the basis. Price reaching Band 3 represents an extreme statistical deviation from the session's equilibrium, often preceding reversion.
Extreme contrarian channel — a separate envelope that behaves inversely to short-term HV. When this channel is wide (low HV, quiet market), price tends to oscillate within it, making the boundaries attractive mean-reversion levels. When the channel narrows sharply (high HV, excited market), it signals compression before a potential breakout.
Band expansion vs contraction — widening bands indicate increasing dispersion and adaptive uncertainty ; narrowing bands indicate consolidation and equilibrium tightening.
Parameters
LB Engine
Source — price field used for calculations (default HLC3).
Reset TF — timeframe at which accumulators reset (default Daily).
Hidden TWAP Length — period for the TWAP used in the TWAP gap weight.
Historical Volatility Length — period for HV calculation (main bands).
HV Smoothing — smoothing period for the HV baseline.
LB Bands
Deviation 1, 2, 3 — base multipliers for the three main deviation levels.
LB Contrarian Channel
Extreme Channel Inner/Outer — sigma multipliers for the contrarian channel.
Use Main HV Weight — applies the main HV weight to the contrarian channel.
Use Hidden TWAP Weight — applies the TWAP gap weight to the contrarian channel.
Contrarian Inverse HV Length — period for the HV used in the inverse weighting.
Contrarian Inverse HV Smooth — smoothing period for the contrarian HV baseline.
Contrarian Inverse HV Min/Max — clamping limits for the inverse weight.
LB Style
Show Basis, Show Main Fills, Color Bars — visual toggles.
Basis Width, Band Width, Extreme Channel Width — line thickness controls.
Reference
This indicator is a proprietary design by Luis Barlier. It synthesises concepts from session volume-weighted average price (VWAP), adaptive volatility bands, and inverse volatility regime detection. It does not correspond to a single academic publication. インジケーター
インジケーター

インジケーター

Alphamojo - Supertrend Strategy HA with Buffer**Title: SuperTrend Heikin Ashi Buffer **
**Overview**
Welcome to the **SuperTrend Heikin Ashi Buffer**! This indicator is designed for trend-following traders who want to filter out market noise and pinpoint high-probability zones. By combining the proven trend-detection capabilities of the SuperTrend with the smoothing effect of Heikin Ashi candles, this tool goes a step further by introducing a dynamic **Price Buffer** to help confirm breakouts and manage risk.
**How It Works**
This indicator relies on three core components working in harmony:
1. **SuperTrend:** Acts as our primary directional compass, identifying whether the market is currently in a bullish or bearish state.
2. **Heikin Ashi Candles:** Instead of using standard Japanese candlesticks, the indicator calculates values based on Heikin Ashi price action to eliminate erratic wicks and clearly define the trend momentum.
3. **Dynamic Buffer Logic:** A customizable buffer zone is applied directly to the extremes of the Heikin Ashi candles depending on the current SuperTrend direction.
**The Buffer Mechanism Explained**
The standout feature of this indicator is how it dynamically shifts the buffer placement based on market conditions:
* 🟩 **Bullish Phase (SuperTrend is Green):** When the SuperTrend flips green, the indicator applies the buffer to the **High** of the Heikin Ashi candle. This is incredibly useful for traders looking for breakout confirmations, ensuring price has truly pushed past the high + buffer before entering long or adding to a position.
* 🟥 **Bearish Phase (SuperTrend is Red):** When the SuperTrend flips red, the indicator applies the buffer to the **Low** of the Heikin Ashi candle. This helps traders identify true breakdowns below the local Heikin Ashi lows + buffer, making it ideal for short entries or trailing stop-loss placement.
**Key Features**
* **Noise Reduction:** Filters out fake-outs by relying on smoothed Heikin Ashi data rather than volatile standard price action.
* **Customizable Inputs:** Adjust the SuperTrend length and multiplier, as well as the exact size of your buffer to fit your specific asset and timeframe.
* **Visual Clarity:** Clean lines on the chart clearly display exactly where the buffer is at all times so you don't have to guess.
**How to Use This Indicator**
* **Breakout Confirmation:** Wait for the standard price to close beyond the Heikin Ashi buffer line before taking a trade in the direction of the SuperTrend.
* **Trailing Stops:** Use the dynamic buffer line as a strict trailing stop-loss to ride massive trends while protecting your capital from sudden reversals.
* **Confluence:** Pair this with volume indicators (like RSI or OBV) to ensure there is strong momentum when price interacts with the buffer zone.
*Disclaimer: This indicator is designed for educational and analytical purposes. Always backtest your strategies and practice proper risk management before trading with real capital.*
*** ### **Tips for Publishing on TradingView:**
* **Add a Chart Screenshot:** Make sure you upload a very clean, visually appealing screenshot of the indicator in action. Try to capture a moment on the chart where the SuperTrend flips and the buffer successfully catches a trend or filters out a fake-out.
* **Keep Settings Flexible:** When coding, make sure the user can change the "Buffer amount" in the inputs menu, as different assets (like Crypto vs. Forex) require vastly different buffer sizes. ストラテジー

Entropic Regime Field [JOAT]Entropic Regime Field is an open-source market state classifier that uses three quantitative measures — Fractal Efficiency Ratio, a synthetic Hurst Exponent approximation, and a Garman-Klass volatility estimator — to classify each bar into one of three entropy states: LOW (predictable, directional structure present), TRANSITION (regime shift underway), and HIGH (chaotic, low-predictability environment). Directional signals from an Adaptive Momentum Oscillator are filtered to fire only during LOW entropy states, where momentum signals have historically more reliable edge than during random or chaotic market behavior.
The foundational premise is that markets alternate between periods of organized directional behavior and periods of disorganized random movement. Trading momentum signals indiscriminately across both environments degrades overall performance because the same signal that has edge in a trending market produces random outcomes in a chaotic one. By measuring the structural organization of price movement directly — rather than relying on ADX alone, which is a lagging momentum derivative — Entropic Regime Field attempts to identify when the market's behavior is organized enough for directional signals to have context.
Core Concepts
1. Fractal Efficiency Ratio (FER)
The FER measures how efficiently price has moved over a lookback period — the ratio of the net directional distance to the total path length of individual bar-to-bar changes. A value near 1.0 indicates straight-line directional movement; a value near 0.0 indicates constant reversals:
float ferNet = math.abs(close - close )
float ferPath = math.sum(math.abs(ta.change(close)), ferLen)
float ferVal = ferPath > 0.0 ? ferNet / ferPath : 0.0
2. Synthetic Hurst Exponent
The Hurst Exponent characterizes the memory of a time series. Values above 0.5 indicate persistence (trending), values near 0.5 indicate randomness, and values below 0.5 indicate anti-persistence (mean-reversion). A simplified Hurst estimate is computed using the variance ratio method:
float var1 = ta.variance(ta.change(close, 1), hurstWindow)
float var5 = ta.variance(ta.change(close, 5) / 5, hurstWindow)
float hurstEst= 0.5 * math.log(var1 / var5) / math.log(5) + 0.5
3. Garman-Klass Volatility Estimator
Standard ATR uses only the prior close and current high/low. The Garman-Klass estimator uses all four OHLC prices, producing a more statistically efficient estimate of true volatility:
gkBar = 0.5 * math.pow(math.log(high / math.max(low, syminfo.mintick)), 2.0)
- (2.0 * math.log(2.0) - 1.0) * math.pow(math.log(close / math.max(open, syminfo.mintick)), 2.0)
The GK estimate is averaged over a configurable period and normalized to a 0-100 percentile rank over the trailing 100 bars.
4. Three-Factor Entropy Classification
LOW entropy requires FER above a threshold AND ADX above a minimum AND Hurst estimate above 0.52. HIGH entropy is triggered when FER falls below a lower threshold OR ADX falls below a minimum. TRANSITION is the state between the two.
5. Adaptive Momentum Oscillator (AMO)
The AMO blends three momentum inputs with fixed weights: RSI(14) centered at 50 (40%), Stochastic(14) centered at 50 (35%), and Williams Percent Range(14) centered at -50 (25%). Directional signals fire only in LOW entropy when AMO crosses zero and KAMA confirms via crossover/under.
Features
Fractal Efficiency Ratio: Net directional move divided by total path length, configurable lookback
Synthetic Hurst Exponent: Variance ratio approximation identifying persistent vs. anti-persistent price behavior
Garman-Klass volatility: OHLC-based volatility estimator normalized to percentile rank over 100 bars
Three entropy states: LOW, TRANSITION, HIGH — each with distinct visual treatment
10-line entropy ribbon: EMA lines colored by entropy state for visual history of regime transitions
Adaptive Momentum Oscillator: RSI + Stochastic + WPR composite with fixed optimal weights
Entropy-gated signals: AMO + KAMA confirmation signals fire only in LOW entropy state
Regime background tint: Background tinted by entropy state, cleared after 10 bars
Trade block on signal: ATR-based TP and stop rendered as boxes on signal bars
12-row institutional dashboard: FER, Hurst estimate, GK volatility percentile, ADX, AMO, entropy state, signal, win rate, bars in current state
Non-repainting: All signals gated by barstate.isconfirmed; no future data referenced
Four color themes: Phantom, Neon, Classic, Solar
Input Parameters
Fractal Efficiency:
FER Lookback (default: 14)
LOW Entropy FER Minimum (default: 0.60)
HIGH Entropy FER Maximum (default: 0.35)
Hurst Exponent:
Hurst Window (default: 20)
LOW Entropy Hurst Minimum (default: 0.52)
Garman-Klass Volatility:
GK Averaging Length (default: 14)
ADX Gate:
Min ADX for LOW Entropy (default: 22)
Signal:
AMO Cross Threshold, KAMA Period, Cooldown Bars
TP ATR Multiple, SL ATR Multiple
How to Use This Indicator
Step 1: Read the Entropy State
Check the dashboard. LOW entropy means the market is behaving in an organized, directional way — this is when momentum signals carry more weight. HIGH entropy means the market is chaotic — avoid directional signals.
Step 2: Watch FER and Hurst Together
FER and Hurst are independent measures of market organization. When both agree (high FER AND Hurst > 0.52 simultaneously), the LOW entropy classification is more reliable.
Step 3: Enter on AMO + KAMA Confirmation
Signals fire only when the AMO crosses zero in the signal direction AND price crosses the KAMA level simultaneously. Both conditions must occur on the same confirmed bar in a LOW entropy environment.
Indicator Limitations
The Hurst approximation via variance ratio is a simplified estimate. It should be treated as a directional indicator of persistence, not a precise statistical measure
The FER computation on every bar may affect chart loading performance for very long lookback periods on large datasets
LOW entropy classifications can persist during slow grinding trends that produce high FER but low volatility. These environments may produce signals with narrower ATR-based targets
The GK estimator can return unreliable values when open equals close (as occurs on some synthetic instruments or during gaps)
This indicator classifies entropy state. It does not predict how long the state will persist or when it will change
Originality Statement
The combination of Fractal Efficiency Ratio, synthetic Hurst Exponent via variance ratio, and Garman-Klass volatility estimator as a three-factor entropy classification system gating AMO momentum signals is not replicated in any existing open-source Pine Script v6 publication as of this writing
The Garman-Klass estimator as a volatility input provides a more statistically efficient OHLC-based volatility measure that captures intraday range information not available in ATR
Gating a composite three-input momentum oscillator by an entropy state derived from completely different mathematical principles (efficiency, persistence, and OHLC volatility) rather than using a single lagging derivative like ADX as the sole filter is an original analytical architecture
Disclaimer
This indicator is provided for educational and informational purposes only. It is not financial advice. Trading involves substantial risk of loss. Entropy classifications are approximations based on historical price data and do not guarantee future market behavior will repeat. The Hurst approximation used is a simplified estimate, not a statistically rigorous computation. Past win rates do not predict future performance. The author accepts no responsibility for trading losses resulting from use of this indicator.
Made with passion by jackofalltrades
インジケーター

インジケーター

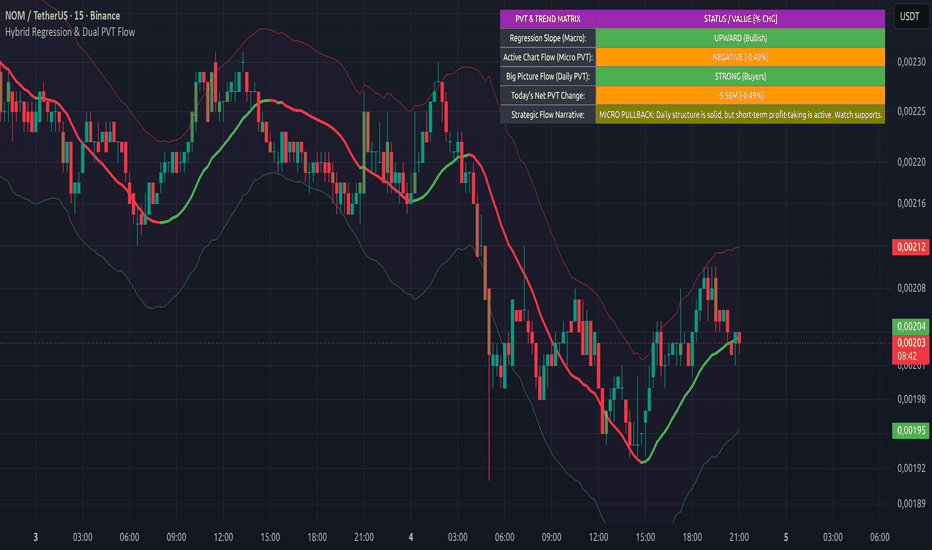
Hybrid Regression & Dual PVT Flow🇺🇸 ENGLISH DESCRIPTION TEXT
Overview
Hybrid Regression & Dual PVT Flow is an institutional-grade hybrid analysis system designed to uncover the footprints of market whales. It bridges the gap between pure price geometry and volume-weighted momentum, preventing retail traders from falling into "bull/bear traps" by exposing hidden institutional accumulation and distribution phases.
Key Technical Pillars:
Linear Regression Core: Computes a noise-filtered baseline representing the true mathematical equilibrium of price. The curve turns green during a bullish slope and red during a bearish slope.
Dynamic Fibonacci Volatility Envelope: Employs an ATR-driven deviation mechanism instead of traditional standard deviations. It projects key institutional overbought (Resistance) and oversold (Support) thresholds based on the 2.618 Fibonacci ratio.
Volume Anomaly Engine: Scans for extreme institutional anomalies where candle volume exceeds 1.5x of its 20-period moving average. These high-activity institutional bars are highlighted in Yellow on your chart.
Dual-Layer Multi-Timeframe PVT Dashboard:
Micro PVT Status: Tracks real-time smart money participation directly on your active trading timeframe (e.g., 5m, 15m, 1h).
Macro PVT Status: Permanently anchors a Daily (1D) Price Volume Trend core against its 10-period EMA, providing an unshakeable perspective of the "Big Picture" regardless of your active asset chart.
How to Read the Intelligence Dashboard:
BULLISH / BEARISH CONVERGENCE: Absolute alignment between the macro trend line and multi-timeframe capital flows. Indicates high-probability trend continuation.
HIDDEN BEARISH DIVERGENCE (Distribution Trap): Price regression slope is upward, but both macro and micro PVT metrics are flashing negative. Highly indicative of institutional selling into retail FOMO.
STRONG ACCUMULATION DIVERGENCE (Whale Accumulation): Price regression slope is sliding downward, but dual-layer PVT inflows are accelerating heavily. Signals structural retail liquidation being absorbed by institutional market makers right before a major reversal.
🇹🇷 TÜRKÇE AÇIKLAMA METNİ
Özet Giriş
Hybrid Regression & Dual PVT Flow, piyasada sıklıkla karşılaşılan "fiyat yükselirken kurumsal oyuncuların arka kapıdan mal çıkması" (dağıtım) veya "fiyat düşerken balinaların dipten gizlice mal toplaması" (akümülasyon) durumlarını yakalamak için tasarlanmış hibrit bir takip sistemidir. Matematiksel gücünü Doğrusal Regresyon Eğrisi ve Çift Katmanlı Price Volume Trend (PVT) momentum motorunun sentezinden alır.
Ana Özellikler:
Doğrusal Regresyon Hattı (Linear Regression Trend): Piyasanın ana dengesini ve makro yönünü gürültüden arındırılmış bir eğri olarak sunar. Eğim yukarıysa yeşil (Boğa), aşağıysa kırmızı (Ayı) olarak grafiğe işlenir.
Dinamik Fibonacci Volatilite Bantları: Klasik Bollinger bantları yerine, ATR (Average True Range) tabanlı dinamik volatilite sınırları kullanır. Üst kırılımlar kurumsal aşırı alım/direnç, alt bantlar ise kurumsal güvenli alım/destek bölgelerini işaret eder.
Hacim Anomalisi Mum Boyama: Son 20 mumun ortalama hacmini %150 aşan ani balina aktivitelerinde, mumlar otomatik olarak Sarı renge boyanarak dikkat çeker.
Çift Katmanlı PVT ve Trend Matris Paneli: * Mikro PVT: Bulunduğunuz anlık aktif grafik zaman dilimindeki (5dk, 15dk, 1sa vb.) para akışı yönünü ölçer.
Makro PVT: Grafiğiniz ne olursa olsun, arka planda Günlük (1D) kurumsal para akışının 10 günlük ortalamasını denetler.
Panel Strateji Notları Nasıl Okunur?
TAM UYUM (BOĞA / AYI): Trend yönü ile tüm vadelerdeki para akışları aynı yöndedir. Güvenli katılım bölgesidir.
GİZLİ AYI UYUMSUZLUĞU (Dağıtım Tuzağı): Regresyon eğrisi yukarı bakarken, hem günlük hem anlık para akışları negatif yönlüdür. Balinaların küçük yatırımcıya mal devrettiği tepe tuzaklarını gösterir.
GİZLİ BOĞA UYUMSUZLUĞU (Mal Toplama): Grafik aşağı akarken, hem günlük hem anlık PVT'nin güçlü yönlü yukarı gitmesidir. Balinaların dipten toplama yaptığını ve sert bir yükselişin yakın olduğunu gösterir. インジケーター
Quantized Regime Vector (QRV)# Quantized Regime Vector (QRV)
## Professional Market Regime & Directional Confluence Overlay
Quantized Regime Vector (QRV) is a multi-factor empirical state-classification engine designed to filter high-frequency market noise into a structured, deterministic directional confluence matrix.
The script systematically evaluates trend structure, higher-timeframe alignment, adaptive moving average behavior, relative volume expansion, volatility dynamics, momentum exhaustion, confirmed divergence, and wick-adjusted order-flow proxy bias. These independent inputs are mapped into an objective, quantitative scoring framework that establishes active market regime classification and directional conviction in real time.
QRV is not a predictive forecasting model. It functions as an objective decision-support framework designed to systematically mitigate adverse selection during low-efficiency market regimes, helping operators evaluate when edge is mathematically present and when conditions are too noisy for execution.
The purpose of QRV is to reduce low-quality signals, organize continuous market context into discrete states, and display aggregate directional strength directly on the interface.
---
## Why “Quantized Regime Vector”?
* **Quantized:** QRV takes continuous, chaotic market inputs and maps them into a structured, finite confluence score. Instead of treating every signal equally, the engine calculates an aggregate value to evaluate whether independent conditions are aligned strongly enough to clear a strict execution floor.
* **Regime:** The system classifies the underlying structural environment via localized trend alignment, multi-timeframe correlation, volatility state tracking, and algorithmic alpha grading.
* **Vector:** QRV evaluates both direction and magnitude. The model calculates long-side and short-side scores completely independently, outputting the active side alongside the raw mathematical strength of the current setup.
---
## Core Algorithmic Components
### 1. Trend Structure
QRV evaluates localized price action in relation to both a mid-term structural moving average and a long-term trend average. This isolates the baseline market state into clear bullish, bearish, or neutral structural regimes.
### 2. Higher-Timeframe Alignment
The framework includes an institutional multi-timeframe trend filter that utilizes **only the previously completed higher-timeframe bar** to ensure zero real-time repainting or forward-looking bias.
* **Timeframe Inversion Protection:** If the selected higher timeframe is less than or equal to the current chart timeframe, the system triggers a `CHECK TF` warning on the dashboard and completely blocks the higher-timeframe contribution from the scoring model to preserve data integrity.
### 3. Adaptive Moving Average Behavior
The engine incorporates a Kaufman Adaptive Moving Average (KAMA) driven by a localized Efficiency Ratio. By adjusting its internal smoothing factor based on trend efficiency, it reduces lag during true expansion legs and flattens out during mean-reverting chop, acting as a dynamic structural barrier for reclaim and breakdown validation.
### 4. Statistical Relative Volume Expansion
Current volume is normalized against historical lookback distributions using a Gaussian Z-score framework:
$$Z = \frac{V - \mu}{\sigma}$$
Elevated Z-scores validate baseline participation necessary to sustain structural breakouts. This metric does not attempt to track specific participants or imply unprovable order-flow mechanics; it is a strict statistical measurement of volume expansion relative to recent historical norms.
### 5. Volatility Expansion Gate
Directional triggers are volatility-gated, requiring localized Average True Range (ATR) expansion to validate execution momentum and filter out mean-reverting noise. If range expansion fails to clear the volatility gate, execution parameters remain locked.
### 6. Momentum Exhaustion Tracking
The system cross-references localized RSI positioning with MACD histogram peaks to flag potential momentum exhaustion points. These conditions indicate exhaustive retail chasing into liquidity pools and should be treated as structural context rather than absolute reversal signals.
### 7. Confirmed Pivot Divergence
The engine includes a non-backplotting divergence system driven by structural pivot points. Divergence labels are printed strictly on the live bar where the pivot confirmation becomes statistically knowable in real time, eliminating retrospective signal placement.
### 8. Wick-Adjusted Flow Bias
A localized volume pressure proxy calculates intra-bar delta based on wick adjustments, categorizing near-term order-flow accumulation or distribution states.
---
## System Risk & Filtration Defaults
The default parameters are intentionally restrictive, prioritizing high-selectivity alignment over high-frequency trading in noisy conditions.
```text
======================================================================
QUANTIZED REGIME VECTOR (QRV) SYSTEM DEFAULTS
======================================================================
• Score Activation Floor : 82 / 110 Total Points
• Volatility Gate Limit : 1.85 × ATR (Noise Isolation)
• Baseline Volume Alpha : ≥ 1.50σ Z-Score
• Major Volume Expansion : ≥ 2.75σ Z-Score
• Signal Cooldown Array : 20 Bars (Cluster Prevention)
• Real-Time Protection : Confirm-on-Close
======================================================================
```
### The QRV Score Engine Matrix
The directional scoring model aggregates weighted confirmations across all core components to assign an objective alpha grade to the live market state:
* **Grade A ($\ge$ 85):** Maximum-probability structural and volume confluence.
* **Grade B ($\ge$ 75):** Strong directional continuation context.
* **Grade C ($\ge$ 65):** Developing structural context.
* **Grade F (< 65):** Insufficient confluence; execution restricted.
---
## The Visual Interface Architecture
### Candle Color System
* **Gold Candle:** High-conviction long execution trigger occurring simultaneous with major relative volume expansion ($Z \ge 2.75$).
* **Crimson Candle:** High-conviction short execution trigger occurring simultaneous with major relative volume expansion ($Z \ge 2.75$).
* **Lime Candle:** Standard long execution trigger meeting all baseline trend, adaptive MA, volume, volatility, and scoring floors.
* **Magenta Candle:** Standard short execution trigger meeting all baseline trend, adaptive MA, volume, volatility, and scoring floors.
* **White Candle:** Isolated Major Relative Volume Expansion ($Z \ge 2.75$). Indicates substantial institutional participation block-clearing or absorption without firing a directional entry signal.
* **Orange Candle:** Momentum exhaustion warning (potential fading structure or near-term reversal context).
* **Dark Green Candle:** Strong bullish structural baseline.
* **Dark Purple Candle:** Strong bearish structural baseline.
* **Gray Candle:** Neutral, compressed, or inactive market condition.
### Telemetry Dashboard
The real-time heads-up display reports live engine metadata including:
* **Entropy State:** `EXPANDING`, `CONTRACTING`, or `TRANSITION` volatility behavior.
* **Bias State:** Real-time accumulation vs. distribution proxy tracking.
* **Command State:** Operational mode tracking (`FIRE`, `STALKING...`, or `SCANNING...`).
* **Bi-Directional Scores:** Independent real-time long and short point values.
* **Core System Metrics:** Volume Z-score tracking, HTF confirmation, and divergence status.
---
## Operational Protocol: How to Use QRV
### For Long Setups
1. Ensure the baseline trend structure and higher-timeframe status report bullish alignment.
2. Monitor the dashboard for an improving, accelerating long score vector.
3. Prioritize Grade-A executions where standard long triggers overlap with dynamic volatility expansion.
4. Utilize localized momentum exhaustion and divergence labels as structural exit or profit-taking context, rather than raw entry signals.
### For Short Setups
1. Ensure the baseline trend structure and higher-timeframe status report bearish alignment.
2. Monitor the dashboard for an improving, accelerating short score vector.
3. Prioritize Grade-A executions where standard short triggers overlap with dynamic volatility expansion.
4. Utilize localized momentum exhaustion and divergence labels as structural exit or profit-taking context, rather than raw entry signals.
### Timeframe Configuration Examples
* **Scalping/Intraday:** 5-Minute Chart with a 30-Minute or 1-Hour HTF Input.
* **Day Trading/Breakouts:** 15-Minute Chart with a 1-Hour or 4-Hour HTF Input.
* **Swing Trading:** 1-Hour or 4-Hour Chart with a Daily HTF Input.
---
## Important Limitations & System Restrictions
* **No Predictive Claims:** QRV evaluates current mathematical alignment based on historical lookback arrays. It does not predict future structural direction or guarantee profitable outcomes.
* **Context vs. Proof:** Statistical relative volume expansion indicates an increase in participation velocity relative to recent norms. It cannot identify specific entity intent or guarantee institutional follow-through.
* **Macro/Event Exclusion:** The engine operates strictly on technical metadata. It cannot account for, protect against, or evaluate incoming economic indicators, earnings releases, central bank decisions, or sudden exogenous liquidity shocks.
* **Chop Regimes:** While the volatility gate and signal cooldown arrays are engineered to systematically mitigate adverse selection, extended low-volume, mean-reverting consolidations can result in performance decay.
---
## Risk Disclaimer
Trading financial instruments, including index futures, commodities, equities, and derivatives, involves a substantial risk of capital loss and is not suitable for every investor. No automated scoring matrix, indicator, or technical framework can eliminate market risk or ensure capital preservation. QRV is provided strictly as an analytical decision-support tool. It should be paired with independent risk management, strict position sizing protocols, robust historical backtesting, and discretionary trader judgment. This material does not constitute financial, legal, or investment advice. Single-point failure mitigation and execution validation remain the sole responsibility of the operator. インジケーター

インジケーター

Katana Signal AUDCAD Entry IndicatorThis indicator visualises the entry logic behind Katana EA v1.4
— an MT4 Expert Advisor I developed privately in 2022 and have
been running on a live account ever since.
━━━━━━━━━━━━━━━━━━━━━━━━━━━━━━━━
HOW THE SIGNAL WORKS
━━━━━━━━━━━━━━━━━━━━━━━━━━━━━━━━
Entry is triggered only when TWO conditions align on the prior
closed bar (shift=1, no repainting):
BUY signal:
• RSI reaches oversold extreme
• Parabolic SAR is below the prior bar's low
SELL signal:
• RSI reaches overbought extreme
• Parabolic SAR is above the prior bar's high
Both conditions must be true simultaneously.
Single-indicator entries are filtered out.
━━━━━━━━━━━━━━━━━━━━━━━━━━━━━━━━
WHY AUDCAD
━━━━━━━━━━━━━━━━━━━━━━━━━━━━━━━━
AUD and CAD are both commodity-linked currencies that move
together the majority of the time. When they temporarily
diverge — due to oil price moves, RBA/BOC policy divergence,
or risk sentiment shifts — mean-reversion setups have strong
structural reasons to work.
This makes AUDCAD one of the cleanest pairs for this type
of strategy. The correlation rarely breaks permanently,
which limits the risk of runaway adverse moves.
━━━━━━━━━━━━━━━━━━━━━━━━━━━━━━━━
DISPLAY SETTINGS
━━━━━━━━━━━━━━━━━━━━━━━━━━━━━━━━
• BUY signal → green triangle below bar
• SELL signal → red triangle above bar
• Parabolic SAR → grey dots (standard display)
• Background highlight on signal bars (can be disabled)
• Info table top-right: SAR direction, current signal status
Strategy parameters are optimised internally and not exposed
— this prevents unintended parameter changes that could
degrade performance.
━━━━━━━━━━━━━━━━━━━━━━━━━━━━━━━━
MT4 AUTOMATION
━━━━━━━━━━━━━━━━━━━━━━━━━━━━━━━━
This indicator shows the entry signals visually.
The automated version (Katana EA v1.4) executes these
entries on MT4 with:
• Dynamic lot sizing — auto-scales with account balance
• Martingale position scaling (max 8 positions)
• Hard stop-loss + 8-hour cooldown after each SL event
• Active hours filter (London + New York session only)
51-month backtest results (Mar 2022 – May 2026):
✓ Net profit: +6,717% on ¥150,000 starting capital
✓ Win rate: 96.5% per trade cycle
✓ Profit factor: 1.54
✓ Stop-losses: 33 in 51 months
✓ Modelling quality: 90% (Every Tick, 60M+ real tick data)
Includes: 2022 Ukraine war oil spike, Trump tariffs,
Middle East conflict periods.
Free 14-day trial + full licence: payhip.com/b/j4d6F
Licence delivery & support: Telegram @KaTa4649
⚠ Requires broker with 500:1 leverage (XM Global recommended)
⚠ Not compatible with US / Canada / UK retail accounts
━━━━━━━━━━━━━━━━━━━━━━━━━━━━━━━━
RECOMMENDED SETUP
━━━━━━━━━━━━━━━━━━━━━━━━━━━━━━━━
For visual analysis: use on AUDCAD 1H or 4H
For the automated EA: runs on AUDCAD M5
Broker: XM Global Standard Account (JPY or USD)
Min capital: ¥150,000 or $1,000 USD インジケーター

インジケーター