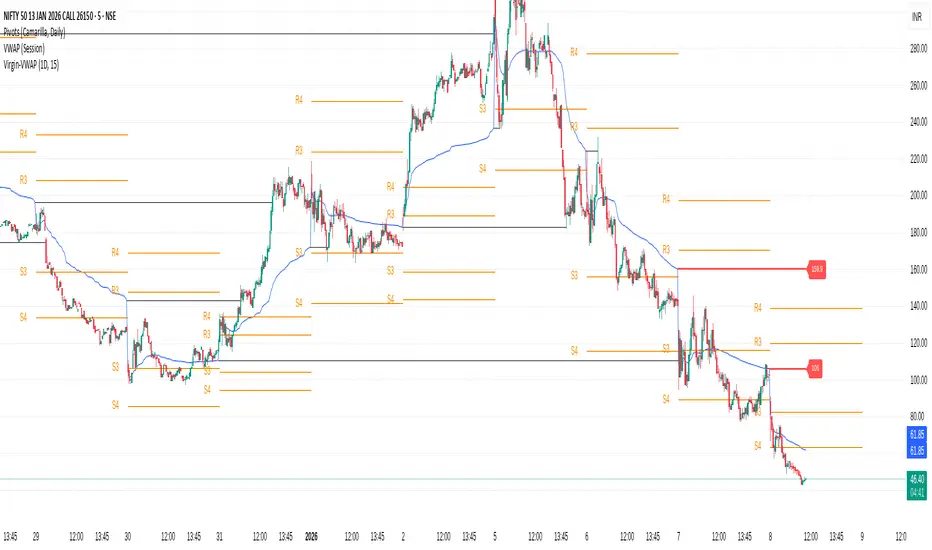
Fabio Valentini Pro Scalper [PickMyTrade]Fabio Valentini Pro Scalper
Inspired by Fabio Valentini's NASDAQ scalping methodology, this strategy approximates professional order flow analysis using volume-based techniques, volume profile, and institutional trading concepts for liquid markets.
CORE METHODOLOGY
This strategy uses volume analysis to approximate order flow concepts typically seen in professional trading platforms:
Volume Profile Analysis: Calculates Point of Control (POC), Value Area High (VAH), and Value Area Low (VAL) to identify institutional price acceptance zones where the majority of trading activity occurs.
Delta Approximation: Estimates buying versus selling pressure by analyzing volume distribution within candles, helping identify which side of the market is in control.
Absorption Detection: Identifies high-volume, low-price-movement candles that indicate institutional passive order absorption - when large players are building positions by absorbing aggressive orders.
Triple-A Setup: Tracks the three-phase institutional trading pattern:
- Absorption - Large players build positions passively
- Accumulation - Price contracts into tight range as positions build
- Aggression - Breakout with volume as institutional move initiates
ENTRY SIGNAL TYPES
Triple-A Setups: Identifies the complete absorption-accumulation-aggression sequence. When absorption is detected, followed by range contraction, and then aggressive breakout with volume confirmation.
Opening Range Breakout (ORB): Trades breakouts from the configurable opening range period (default 30 minutes). Based on the concept that early session range defines key levels.
Value Area Bounces: Identifies reactions at Value Area High or Value Area Low levels with absorption confirmation, suggesting institutional support or resistance.
KEY FEATURES
- VWAP with Dynamic Bands: Volume-weighted average price with ATR-based bands for trend and mean reversion context
- Session-Based Filtering: Fully customizable trading session (default NY hours 9:30 AM - 4:00 PM)
- Built-in Risk Management: Customizable risk percentage per trade with adjustable Risk:Reward ratios
- Daily Loss Limit: Enforces maximum daily losses rule (default 3 losses) to prevent overtrading
- Trailing Stop System: Optional ATR-based trailing stops to lock in profits
- Real-Time Dashboard: Shows delta control, absorption status, market phase, and session information
- Multiple Signal Filters: Combine or isolate different setup types for optimization
CUSTOMIZABLE PARAMETERS
Session Settings: Trading session times (any timezone), session filter enable/disable
Volume Profile: Lookback period (default: 50 bars), row resolution for price levels (default: 24 rows)
Absorption Detection: Volume multiplier threshold (default: 2.0), maximum price movement threshold (default: 0.3 ATR)
Delta Analysis: Smoothing period (default: 5 bars)
VWAP Settings: Enable/disable VWAP filter, band width multiplier (default: 0.5 ATR)
Risk Management: Risk per trade percentage (default: 1%), Risk:Reward ratio (default: 2.0), maximum daily losses before stopping (default: 3), trailing stop toggle and ATR multiplier (default: 1.5)
Opening Range Breakout: ORB period in minutes (default: 30), enable/disable ORB signals
VISUAL ELEMENTS
The strategy provides comprehensive visual feedback including VWAP bands, volume profile levels (POC, VAH, VAL), ORB lines, absorption signals, Triple-A setup markers, entry arrows with labels, session background highlighting, live statistics table, and daily loss limit warning background.
BUILT-IN ALERT CONDITIONS
Long and Short entry signals, strong absorption detection, Triple-A setup completion, and daily loss limit warnings.
STRATEGY PHILOSOPHY
Based on institutional trading principles: identify where large players are positioning through absorption patterns, wait for the accumulation phase shown by range contraction, then trade the aggressive move during expansion. The strategy combines multiple confirmation factors to filter high-probability setups.
IMPORTANT NOTES AND DISCLAIMERS
Not True Order Flow: This script approximates order flow concepts using publicly available volume data. True order flow analysis requires tick-by-tick bid/ask data from specialized platforms (e.g., Sierra Chart, Investor/RT with exchange feeds). This implementation provides educational approximation using TradingView's available data.
Performance Sensitivity: Scalping strategy results are extremely sensitive to commission rates, slippage assumptions, position sizing decisions, parameter optimization for specific instruments, and market conditions.
Cost Configuration Required: Before backtesting or live use, you MUST configure the Properties tab with realistic trading costs:
Commission: Set to match your broker's actual fee structure (crypto spot: typically 0.05-0.20% per side, crypto futures: typically 0.02-0.05% per side, stock/futures: varies by broker and contract)
Slippage: Set based on instrument liquidity (high liquidity: 2-5 ticks, medium liquidity: 5-10 ticks, lower liquidity or volatile conditions: 10+ ticks)
Even small changes in commission or slippage can significantly impact profitability for scalping strategies.
Parameter Optimization: Default settings are educational starting points. Users should test different absorption multiplier values (1.5-3.5), experiment with Risk:Reward ratios (2.0-4.0), try each signal type individually to find best performers, adjust parameters for their specific instrument and timeframe, and always validate changes with forward testing.
Market Dependence: Strategy performance varies significantly across different instruments (futures vs crypto vs stocks), various timeframes (1-min vs 5-min vs 15-min), market conditions (trending vs ranging vs volatile), and trading sessions (high vs low liquidity periods).
Educational Purpose: This strategy demonstrates order flow concepts, volume profile analysis, and institutional trading patterns for learning purposes. It is not a guaranteed profitable system and requires user optimization.
RISK WARNING
Scalping strategies require strict discipline and emotional control, excellent execution infrastructure (low latency, reliable fills), understanding of costs impact on profitability, respect for daily loss limits to prevent revenge trading, and realistic expectations - backtest results typically exceed live performance.
This strategy enforces a daily loss limit (default 3 losses) based on professional trading risk management principles. When the limit is reached, the strategy stops generating signals to prevent overtrading.
DISCLAIMER
This is an educational tool for learning order flow concepts and institutional trading patterns. It is not financial advice. Past performance does not guarantee future results. Strategy profitability is highly dependent on execution quality, trading costs, parameter optimization, and market conditions. Users are solely responsible for their own testing, risk management, and trading decisions. No trading strategy is guaranteed to be profitable. Always test thoroughly on paper accounts before risking real capital.
ストラテジー

インジケーター

インジケーター

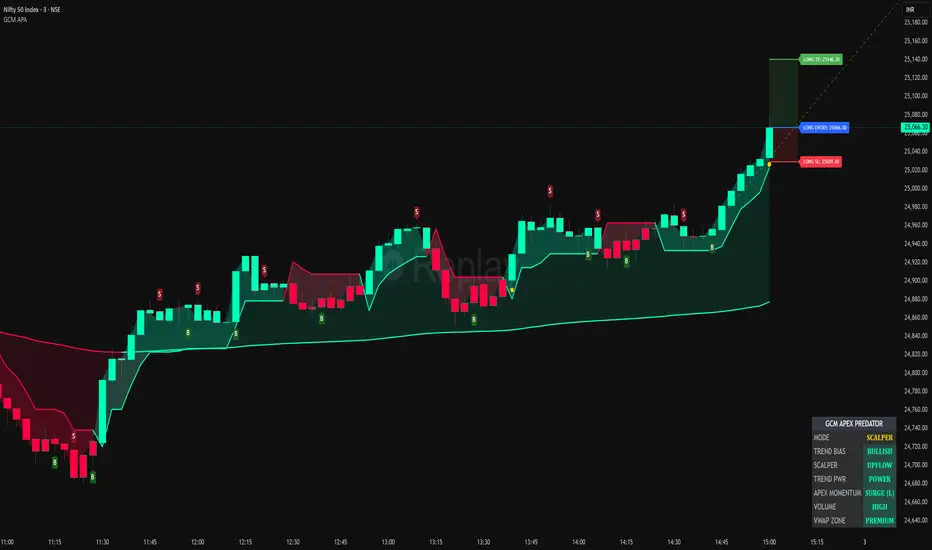
GCM Apex Predator AlgoTitle: GCM Apex Predator Algo
Overview
The GCM Apex Predator is a high-performance, multi-engine trading system designed for traders who demand precision and clarity. Whether you are a fast-paced scalper or a patient swing trader, this algorithm adapts to market conditions using a sophisticated "Apex Score" momentum engine combined with institutional-grade volume and trend filters.
Key Features
• Triple Engine Logic: Switch seamlessly between Scalper Mode (Fast), Trend Mode (Swing), or a Hybrid setup that captures both micro-moves and macro-trends.
• Apex Score Momentum: A proprietary loop-based engine that calculates the "persistence" of price action. It filters out "fake" moves by ensuring momentum is backed by structural strength.
• Institutional Filters: Includes built-in ADX Trend Power and Relative Volume filters to keep you out of "chop" and only in high-probability trades.
• Dynamic Risk Management: Automatically calculates and draws Entry, Stop Loss (SL), and Take Profit (TP) zones using ATR-based volatility, giving you a professional "desk" feel.
• Corporate Dashboard: A real-time HUD (Heads-Up Display) that monitors Trend Bias, ADX Power, Apex Momentum, and VWAP positioning at a glance.
How to Use
1. Select Your Mode: Use the "Scalper Mode" for lower timeframes (1m, 5m) or "Trend Mode" for higher timeframes (1h, 4h).
2. The "Sniper" Signal: Look for the Gold Circle symbols. These represent "Sniper" entries where all engines (Trend, Volume, and Apex) align for a high-conviction move.
3. Market Structure: Pay attention to the dashed reversal lines. These project potential structural shifts based on fast-reversal HMA logic.
Alerts
This indicator is fully optimized for Any alert() function call. You can set one single alert to receive detailed notifications like:
• 🎯 SNIPER LONG: BTCUSD @ 65000
• ⚡ SCALP BUY: EURUSD @ 1.0850
Disclaimer
Trading involves significant risk. This tool is for educational and technical analysis purposes. Past performance does not guarantee future results.
インジケーター

インジケーター

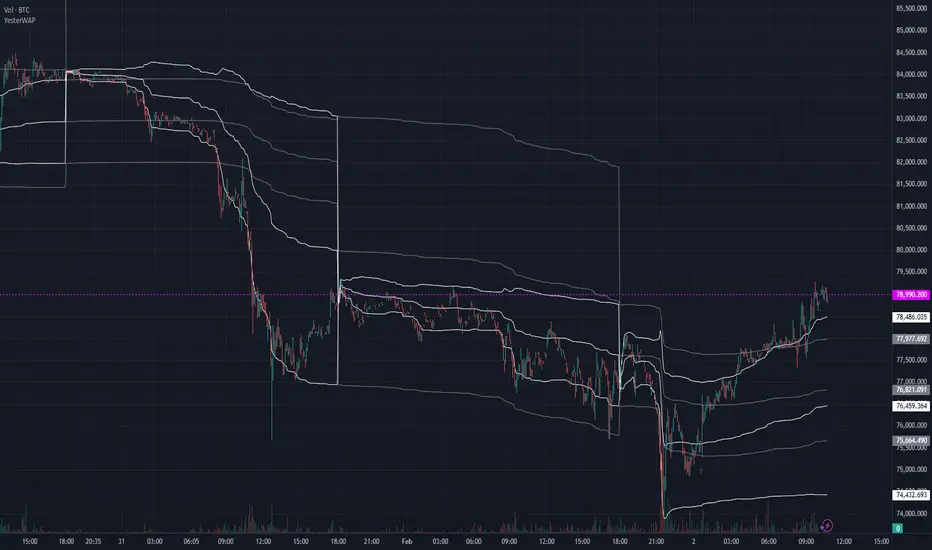
Multi Market VWAP SystemMulti‑VWAP — Adaptive, Multi‑Session Anchored VWAP Suite
Multi‑VWAP is a comprehensive, multi‑session Volume‑Weighted Average Price engine designed for traders who rely on precise, session‑aware VWAP levels across equities, futures, and crypto.
Built for Pine Script v6, it handles complex market structures, custom anchor dates, and non‑standard trading sessions with robust error‑tolerant logic.
What This Indicator Does
This tool calculates and displays a full suite of anchored VWAPs, including:
Standard Period VWAPs
- Daily
- Weekly
- Monthly
- Yearly
To‑Date VWAPs
- Week‑to‑Date (WTD)
- Month‑to‑Date (MTD)
- Year‑to‑Date (YTD)
Custom Anchored VWAP
- Anchor to any user‑selected date
- Automatically recalculates from the first bar of that date
- Works across all markets, including 24/7 crypto
Multi‑Day Rolling VWAPs
Optional rolling VWAPs for:
- 2‑day
- 3‑day
- 4‑day
- 5‑day
- 10‑day
- 20‑day
- 50‑day
Each VWAP can be toggled individually for a clean, customizable chart.
Key Features
✔ Market‑Adaptive Session Handling
Automatically adjusts for:
- Regular equities sessions
- Futures extended hours
- 24/7 crypto markets
- Holidays (via MarketHolidays library)
✔ Clean, Efficient, Pine v6 Architecture
- No deprecated functions
- No array overflows
- No undefined variables
- Defensive programming for unsupported markets
- Optimized for performance on lower‑timeframe charts
✔ Visual Clarity & Control
- Independent color and visibility toggles
- Optional labels showing VWAP values
- Smart timestamp anchoring for all VWAP types
- Minimal chart clutter with maximum information density
Who This Indicator Is For
This tool is ideal for traders who rely on VWAP structure for:
- Intraday mean‑reversion
- Swing anchoring
- Multi‑session bias
- Institutional level mapping
- Crypto VWAP structure where no “session” exists
If you use VWAP as a core part of your workflow, this script gives you the flexibility and precision needed for modern multi‑market trading.
Notes
- This script does not repaint.
- All VWAPs are calculated using standard cumulative volume‑weighted methodology.
- Custom date VWAP begins at the first bar of the selected date on the chart’s timeframe.
インジケーター

インジケーター

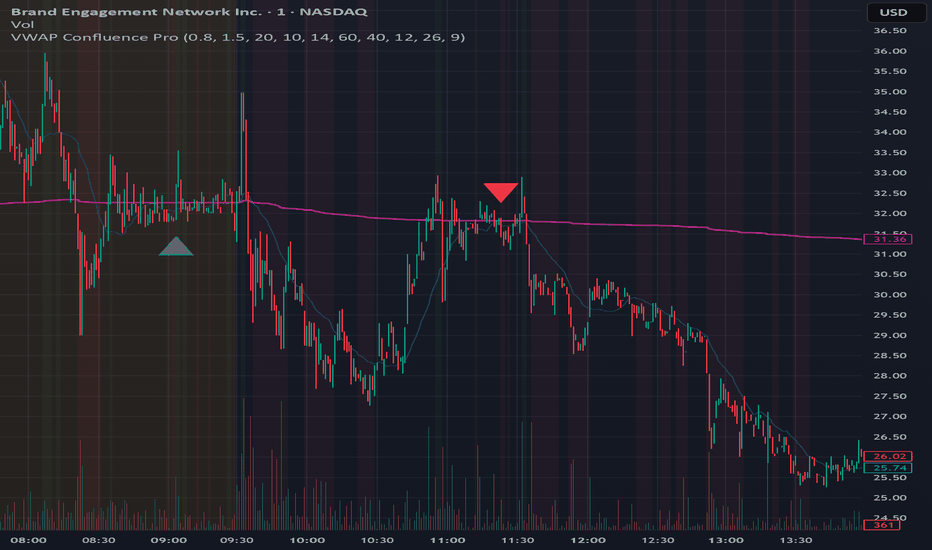
VWAP Confluence Pro█ OVERVIEW
VWAP Confluence Pro is a high-precision trading indicator that combines VWAP with multiple confirmation filters to generate reliable buy and sell signals. Unlike basic VWAP crossover strategies that produce excessive noise, this indicator requires alignment across six independent conditions before triggering a signal, dramatically reducing false entries while capturing high-probability setups.
█ FEATURES
Multi-Layer Confirmation System
The indicator employs a strict confluence approach requiring all of the following conditions to align:
- VWAP Cross: Price must cross above (buy) or below (sell) the VWAP line
- VWAP Trend: The VWAP itself must be rising for buys or falling for sells, confirming directional bias
- Price Trend: A 20-period moving average filter ensures trades align with the prevailing trend
- Volume Confirmation: Signals only trigger when volume exceeds 1.5x the 20-bar average, indicating institutional participation
- RSI Filter: Buys require RSI between 50-60 (bullish momentum without overbought conditions), sells require 40-50 (bearish momentum without oversold conditions)
- MACD Momentum: MACD must confirm directional bias with the MACD line above the signal line for buys, below for sells
Signal Cooldown Period
A configurable cooldown mechanism (default 10 bars) prevents signal clustering and overtrading by ensuring adequate spacing between alerts. This feature is critical for maintaining discipline and avoiding choppy market conditions.
Visual Elements
- Purple VWAP Line: The cornerstone of the strategy, plotted with high visibility
- Green Up Arrows: Buy signals appear below price candles when all conditions align
- Red Down Arrows: Sell signals appear above price candles when all conditions align
- Blue Trend MA: A semi-transparent moving average provides visual trend context
- Background Shading: Subtle green/red backgrounds indicate when multiple confluence factors are aligned, even without a cross
█ HOW TO USE
Timeframe Selection
This indicator is optimized for intraday trading on 1-minute to 15-minute charts, where VWAP is most effective. It can also be used on hourly charts for swing trade entries or daily charts with appropriate parameter adjustments.
Parameter Optimization
All key parameters are customizable through the indicator settings:
- VWAP Deviation %: Controls sensitivity (default 0.8%). Lower values = stricter signals
- Volume Multiplier: Defines volume threshold (default 1.5x). Higher values = stronger volume confirmation required
- Trend Filter Length: Moving average period (default 20). Adjust based on your timeframe
- Cooldown Period: Minimum bars between signals (default 10). Increase for slower markets
- RSI/MACD Settings: Standard values provided, adjust for specific instruments if needed
Trading Strategy
1 — Wait for a signal arrow to appear (green for buy, red for sell)
2 — Confirm the background shading supports the signal direction
3 — Enter on the close of the signal candle or the open of the next candle
4 — Set stop loss below/above the recent swing low/high or the VWAP line
5 — Take profit at logical resistance/support levels or when opposing confluence develops
Best Practices
- Only take long trades when price is above a rising VWAP
- Only take short trades when price is below a falling VWAP
- Avoid trading during low volume periods (first/last 15 minutes of sessions)
- Use the background shading to gauge overall market bias between signals
- Consider increasing the cooldown period in choppy or range-bound conditions
█ LIMITATIONS
- This indicator is designed for trending markets and will produce fewer signals during consolidation periods
- The strict confluence requirements mean you may miss some valid moves in exchange for higher signal quality
- VWAP resets at the start of each session, making it less reliable on 24-hour markets without session breaks (use anchored VWAP for crypto/forex)
- Requires real-time volume data to function properly, less effective on thinly traded instruments
- Not suitable for scalping strategies requiring rapid entries, as the cooldown mechanism intentionally limits signal frequency
█ NOTES
Signal Quality Over Quantity
This indicator prioritizes accuracy over frequency. You may only see 1-3 signals per session on lower timeframes, but each signal represents a setup where trend, momentum, and volume are all aligned. This approach is designed to keep you out of low-probability trades and focused on the best opportunities.
Customization Encouraged
The default parameters provide a solid foundation, but different instruments and timeframes may benefit from optimization. Test the indicator across various settings to find what works best for your specific trading style and markets.
═════════════════════════════════════════════════════════════════════════
This indicator synthesizes best practices from institutional VWAP trading with momentum confirmation from RSI and MACD. By requiring multiple independent factors to align, it filters out the noise common in single-indicator systems and focuses on setups where probability favors directional moves. インジケーター
インジケーター

インジケーター

インジケーター

インジケーター

VWAP Timeframe Continuity (Multi-Period Anchored VWAP Alignment)Visualizes full timeframe continuity using anchored VWAPs from multiple periods — Yearly (12M), Quarterly (3M), Monthly, Weekly, Daily, 4H, 1H, 30m, and 15m (selectable).
Green candles & upper composite line:
Price above all selected VWAPs → strong bullish alignment
Red candles & lower composite line:
Price below all → strong bearish alignment
Gray/neutral: Mixed signals
Includes flip labels, customizable colors, and alerts when full continuity starts (up or down).
Great for trend confirmation, avoiding counter-trend trades, and spotting institutional bias across horizons. Toggle timeframes in settings to match your style!
(Pro tip: Longer anchors like Yearly/Quarterly carry more weight for swing/position trading.) インジケーター

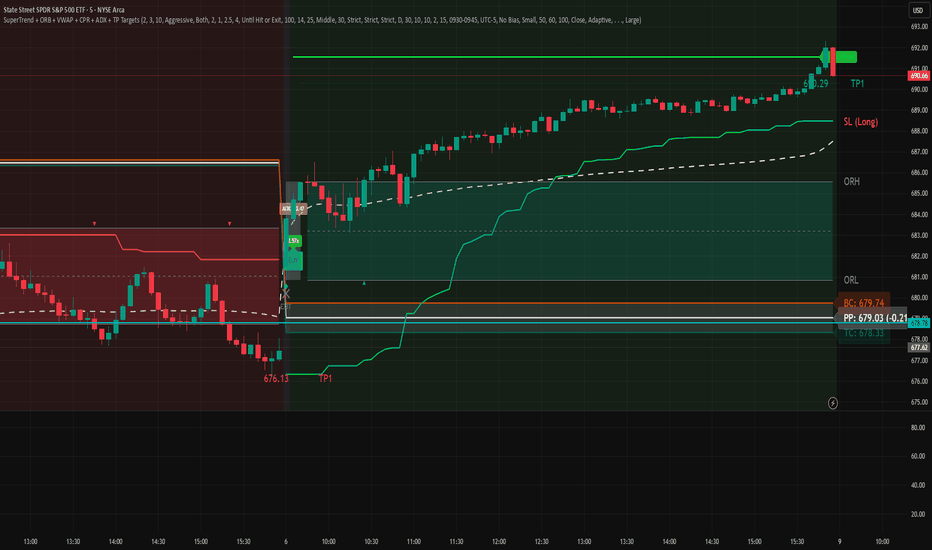
SuperTrend - With Exits & Trade ZonesSuperTrend - With Exits & Trade Zones
Overview
An advanced trend-following indicator that combines pivot points with the SuperTrend methodology to create a complete trading system with entry signals, exit signals, and visual trade zones. This indicator adapts to market structure rather than just price action, providing more reliable trend identification.
What Makes This Unique
Unlike standard SuperTrend indicators that use moving averages, this version:
Uses actual pivot points to calculate a dynamic center line
Provides multiple entry mode options for different trading styles
Shows clear exit signals (both trailing stop and take profit)
Color-codes the entire chart into trade zones (Long, Short, No Trade)
Eliminates guesswork about when to enter, exit, and stay out
Features
📊 Core Indicator Components
Pivot Point Detection: Identifies local highs and lows in price structure
Dynamic Center Line: Weighted calculation using detected pivot points
ATR-Based Bands: Volatility-adjusted upper and lower bands
Trailing Stop Line: Adaptive stop-loss that follows the trend
🎯 Entry Signals
Four entry modes to match your trading style:
Immediate Mode ⚡
Signals right when the trailing stop breaks
Fastest entries for aggressive traders
Best for strong trending markets
Aggressive Mode 🔥 (Recommended)
Signals when price closes beyond break candle OR opens beyond it
Balanced speed and confirmation
Good for most market conditions
Balanced Mode ⚖️
Requires entire candle to close beyond break level
Moderate confirmation
Reduces false breakouts
Conservative Mode 🛡️
Waits for candle to open AND stay completely beyond break level
Highest confirmation, slowest entries
Best for choppy markets
🚪 Exit Signals
Three exit strategies:
Trailing Stop
Exits when price crosses back through the trailing stop line
Lets profits run in trending markets
Protects gains when trend weakens
Take Profit %
Exits at predetermined profit target
Locks in gains at specific percentage
Good for range-bound markets
Both
Uses whichever exit comes first
Combines profit protection with trend following
Recommended for most traders
🎨 Visual Trade Zones
Color-coded backgrounds eliminate confusion:
🟢 Light Green: Active LONG position
🔴 Light Red: Active SHORT position
⚫ Gray: NO TRADE ZONE (between exit and next signal)
📍 Additional Visual Elements
Diamond markers: Show when trailing stop is first broken
BUY/SELL labels: Clear entry signals in green/red
EXIT markers: Gray X for stop loss, Orange X (TP) for take profit
Pivot points: Optional display of detected highs/lows (H/L markers)
Support/Resistance: Optional circles at pivot levels
Settings & Parameters
Basic Settings
Pivot Point Period (default: 2)
Controls sensitivity of pivot detection
Lower = more pivots detected (more responsive)
Higher = fewer pivots (more stable)
ATR Factor (default: 3)
Distance multiplier for trailing stop bands
Lower = tighter stops (more signals, earlier exits)
Higher = wider stops (fewer signals, longer trades)
ATR Period (default: 10)
Lookback period for volatility calculation
Affects how quickly bands adapt to volatility changes
Entry Configuration
Entry Mode: Select from Immediate/Aggressive/Balanced/Conservative
Determines how quickly the indicator generates signals after a trend break
Exit Configuration
Exit Method: Choose Trailing Stop, Take Profit %, or Both
Take Profit % (default: 2%)
Set your profit target as percentage of entry price
Adjust based on volatility and timeframe
Display Options
Show Buy/Sell Labels: Toggle entry signal labels
Show Exit Signals: Toggle exit markers
Show Break Candles: Toggle diamond markers on trend breaks
Show Pivot Points: Display H/L markers at pivot points
Show PP Center Line: Display the dynamic center line
Show Support/Resistance: Display circles at S/R levels
How to Use
For Swing Traders
Set Entry Mode to "Balanced" or "Conservative"
Use "Both" exit method with 3-5% take profit
Enable all visual elements for complete market picture
Trade only in direction of colored zones
For Day Traders
Set Entry Mode to "Aggressive" or "Immediate"
Use "Trailing Stop" exit method to catch intraday trends
Lower ATR Factor to 2-2.5 for tighter stops
Watch for quick signals in the first 2 hours of trading
For Position Traders
Use higher timeframes (Daily/Weekly)
Set Entry Mode to "Conservative"
Increase Take Profit % to 5-10%
Use larger ATR Factor (4-5) for wider stops
General Trading Rules
✅ DO: Enter on BUY/SELL signals (green/red backgrounds)
✅ DO: Exit on EXIT/TP markers
❌ DON'T: Enter during gray NO TRADE ZONE
❌ DON'T: Counter-trend trade against the colored zone
Alerts
Set up the following alerts for automated trading notifications:
Buy Signal: Triggers when long entry conditions are met
Sell Signal: Triggers when short entry conditions are met
Exit Long: Triggers when long position should be closed
Exit Short: Triggers when short position should be closed
Trailing Stop Broken: Triggers on initial trend change
Best Practices
Timeframe Selection
1-5 min: Scalping (use Immediate/Aggressive mode)
15-60 min: Day trading (use Aggressive/Balanced mode)
4H-Daily: Swing trading (use Balanced/Conservative mode)
Weekly: Position trading (use Conservative mode)
Risk Management
Always use the EXIT signals - don't hold through gray zones
Position size based on distance to trailing stop
Never risk more than 1-2% per trade
Consider wider stops on higher timeframes
Market Conditions
Trending markets: Use Aggressive mode, Trailing Stop exits
Ranging markets: Use Conservative mode, Take Profit exits
High volatility: Increase ATR Factor, use Both exits
Low volatility: Decrease ATR Factor for tighter stops
Technical Details
Calculation Method
Detect pivot highs and lows using specified period
Calculate weighted center line: (previous_center × 2 + new_pivot) / 3
Calculate bands: Upper = Center - (ATR Factor × ATR), Lower = Center + (ATR Factor × ATR)
Determine trend based on price position relative to bands
Trail stop line follows the active trend direction
Signal Logic
Entry signals generated based on selected confirmation mode
Position tracking maintains state from entry to exit
Exit signals calculated from both trailing stop and take profit levels
Trade zones update in real-time based on position state
Limitations & Considerations
Works best in trending markets; may generate false signals in tight ranges
Not a holy grail - should be used with proper risk management
Past performance does not guarantee future results
Recommended to backtest on your specific instrument and timeframe
Consider combining with volume analysis or other indicators for confirmation
Version History
v1.0: Initial release with entry signals and confirmation modes
v1.1: Added exit signals (trailing stop and take profit)
v1.2: Added color-coded trade zones (Long/Short/No Trade)
Credits
Original Pivot Point SuperTrend concept by LonesomeTheBlue
Modified with exit signals and trade zone visualization
License
Mozilla Public License 2.0
Example Setups
Conservative Swing Trading
Pivot Point Period: 2
ATR Factor: 3
ATR Period: 10
Entry Mode: Conservative
Exit Method: Both
Take Profit %: 4%
Aggressive Day Trading
Pivot Point Period: 2
ATR Factor: 2.5
ATR Period: 10
Entry Mode: Aggressive
Exit Method: Trailing Stop
Position Trading
Pivot Point Period: 3
ATR Factor: 4
ATR Period: 14
Entry Mode: Balanced
Exit Method: Both
Take Profit %: 8%
Disclaimer: This indicator is for educational purposes only. Trading involves substantial risk. Always do your own research and never trade with money you cannot afford to lose. インジケーター
インジケーター
Key Zone$ - Support and Resistance0DTE Bounce Zones (6M) — Support & Resistance with VWAP, Volume, and Risk Management
This indicator is built for intraday and 0DTE options trading, focused on high-quality bounce and rejection setups at historically proven support and resistance zones.
It automatically identifies key zones from six months of historical price action and waits for real-time confirmation before signaling CALL or PUT opportunities. The goal is to reduce noise, avoid weak bounces, and provide clear, rules-based trade structure.
====================================================================
CORE FEATURES
====================================================================
Historical Support & Resistance Zones (6 Months)
Zones are built using 15-minute pivot highs and lows.
A zone must be tested at least 3 times to be considered valid.
Nearby zones are merged automatically to reduce clutter.
Zones extend forward in time and update dynamically.
Support zones are shown in green, resistance zones in red.
These are higher-quality structural levels, not same-day levels.
====================================================================
0DTE-Focused Entry Logic
Signals only trigger when price interacts with a confirmed zone and shows a strong rejection candle.
Signals are limited to high-probability trading windows only.
Market Open: 9:30–10:45 ET
Market Close: 3:00–4:00 ET
This avoids midday chop and focuses on periods with real momentum.
====================================================================
VWAP Confirmation (Strict)
CALL setups require a VWAP reclaim.
PUT setups require a VWAP loss.
This aligns trades with institutional order flow instead of counter-trend noise.
====================================================================
MACD Momentum Filter
MACD histogram behavior is used to confirm momentum direction and avoid taking bounces against the prevailing move.
====================================================================
ATR Candle Strength Filter
The signal candle must be large enough relative to ATR.
This filters out weak or indecisive candles that often fail with 0DTE.
====================================================================
Advanced Volume Confirmation (Relative Volume)
Relative Volume (RVOL) is used instead of raw volume.
Different RVOL thresholds are applied for CALLS versus PUTS.
Higher RVOL is required for PUTS due to downside urgency.
Lower RVOL is allowed for CALLS due to grind-up behavior.
Separate RVOL thresholds are used for the market open and market close.
This ensures signals only occur when real participation is present.
====================================================================
Built-In Risk Management (2:1 Reward/Risk)
Every signal automatically calculates an entry, stop loss, and target.
Stop loss is based on the zone edge with an ATR buffer.
Targets default to a 2:1 reward-to-risk ratio.
Entry, stop, and target levels are drawn directly on the chart and included in alerts.
====================================================================
Smart Alerts (CALLS & PUTS)
Alerts trigger only when all conditions are met.
Alerts include trade direction, entry price, stop price, target price, and RVOL information.
Alerts are designed for 5-minute confirmation trading.
To use alerts, select “Any alert() function call” when creating the alert.
====================================================================
INTENDED USE
====================================================================
0DTE options trading.
5-minute chart confirmation.
Index ETFs and liquid equities such as SPY, QQQ, IWM, and SPX.
Traders who want aggressive entries with confirmation.
Traders who value structure, volume, and risk control.
====================================================================
NOTES
====================================================================
This is not a prediction tool.
Signals require discipline and confirmation.
Best results come from trading only the highest-quality setups. インジケーター

NeuraEdge ORB - Opening Range Breakout IndicatorOVERVIEW
NeuraEdge ORB is an open-source Opening Range Breakout indicator that automates the classic 15-minute ORB strategy. The indicator tracks the first 15 minutes of market action (9:30-9:45 AM ET), identifies breakouts above or below this range, and generates trading signals with automated stop loss and take profit calculations.
The Opening Range Breakout concept is based on the observation that the initial price action after market open often establishes directional bias for the trading session, as institutional order flow and overnight gap reactions manifest during this window.
CORE METHODOLOGY
Opening Range Construction:
The indicator uses session-based time detection to identify the 9:30-9:45 AM Eastern Time window. During this period, it tracks the highest high and lowest low to establish the opening range boundaries. The range is marked complete when the 15-minute window closes.
Calculation process:
OR High = Maximum high value during the 15-minute window
OR Low = Minimum low value during the 15-minute window
OR Midpoint = (OR High + OR Low) / 2
Range Size = OR High - OR Low (compared to 14-period ATR for context)
Breakout Detection:
The indicator identifies breakouts using close-price confirmation to reduce false signals from wicks:
Bullish breakout: Close above OR High (with previous close at or below OR High)
Bearish breakout: Close below OR Low (with previous close at or above OR Low)
The indicator tracks whether each direction has already broken to prevent duplicate signals on the same range.
Entry Type Logic:
Two entry methodologies are supported:
Breakout Mode - Signals immediately upon range break. Enters on the breakout bar when close confirms direction.
Retest Mode - Waits for price to break the range, then pullback to touch the range level before entering. Cancels if price moves too far beyond midpoint. This provides better entry prices with tighter stop losses.
Volume Confirmation:
Optional volume filter compares current bar volume to 20-period simple moving average. Requires volume > 1.2x average to validate breakout strength and filter low-conviction moves.
Fair Value Gap (FVG) Integration:
Optional confluence filter that checks for unfilled FVG in the breakout direction:
Bullish FVG detected when: current bar's low > two bars ago high (creating gap)
Bearish FVG detected when: current bar's high < two bars ago low (creating gap)
Minimum FVG size: 0.3x ATR to filter noise
FVG considered filled when price retraces to gap midpoint
Signals only generate when an unfilled FVG exists in the breakout direction, adding institutional order flow confluence.
Risk Management Calculations:
Three stop loss placement methods:
Opposite Side - SL at opposite end of opening range (classic ORB approach)
Midpoint - SL at range midpoint (tighter risk, lower reward potential)
ATR Based - SL at 1.5x ATR from entry (adaptive to volatility)
Take profit calculated as: Entry ± (Entry - Stop Loss) × Risk:Reward Ratio
Default 1.5:1 R:R ratio, adjustable from 1.0 to 5.0.
Performance Tracking:
The indicator maintains a trade history using Pine Script's type system:
Records entry price, stop loss, take profit, and direction for each signal
Tracks outcome when price hits stop loss or take profit levels
Auto-closes after 80 bars if neither level hit
Calculates rolling win rate from last 50 trades maximum
Displays W/L record in real-time dashboard
VISUAL COMPONENTS
Opening Range Box:
Semi-transparent blue box drawn from range start bar to current bar + 20, showing the established range boundaries visually.
Range Levels:
Green line at OR High (potential long entry level)
Red line at OR Low (potential short entry level)
Gray dotted line at OR Midpoint (reference level)
All lines extend 50 bars forward for anticipation.
Trade Signals:
Green up arrow with "LONG ORB Break" label below price
Red down arrow with "SHORT ORB Break" label above price
Dashed lines showing SL and TP levels extending 30 bars
Small labels marking SL and TP endpoints
Real-Time Dashboard:
Top-right panel displaying:
OR formation status (Forming / Complete / Waiting)
Current OR High, Low, and Range size (with ATR multiple)
Breakout status (Long / Short / None)
Volume status (High / Normal)
FVG presence (Bull / Bear / None)
Entry settings (Breakout/Retest, R:R, SL type)
Win rate percentage and W/L record
PRACTICAL APPLICATION
Ideal Market Conditions:
Liquid instruments: SPY, QQQ, IWM, high-volume stocks
Recommended timeframes: 1-minute or 5-minute charts for precise entries
Most effective during trending days with clear directional bias
Range size between 0.5-1.5x ATR typically provides best risk:reward
Usage Workflow:
Apply indicator at market open (9:30 AM ET)
Observe range formation during first 15 minutes
Wait for "Complete" status in dashboard
Monitor for breakout signals with volume/FVG confirmation
Enter on signal, place stop loss and take profit as marked
Avoid taking opposing signals on same day (trend following approach)
Retest vs Breakout Selection:
Use Breakout mode on high-momentum days with strong overnight gaps
Use Retest mode on slower days or when seeking better entry prices
Retest mode reduces signal frequency but improves entry quality
Time-of-Day Considerations:
The indicator includes a trading cutoff setting (default 3:00 PM ET) to avoid late-day chop and reduced liquidity. First-hour breakouts (10:00-11:00 AM) historically show strongest follow-through.
SETTINGS & CUSTOMIZATION
Display Options:
Toggle signals, opening range box, and dashboard independently
Clean visual design to reduce chart clutter
Opening Range Settings:
Opening range duration (5-60 minutes in 5-minute increments)
Default 15 minutes aligns with classic ORB methodology
Trading cutoff hour (10-16, representing 10:00 AM - 4:00 PM ET)
Entry Configuration:
Entry type (Breakout / Retest)
Volume confirmation toggle (requires 1.2x average volume)
FVG confluence toggle (requires unfilled gap in breakout direction)
Risk Management:
Stop loss placement (Opposite Side / Midpoint / ATR Based)
Risk:reward ratio (1.0 - 5.0, default 1.5)
Future: Trail stop after partial TP (currently placeholder)
Alert System:
Five alert conditions available:
Opening Range Complete
ORB Long Signal
ORB Short Signal
Breakout Up (range broken, regardless of signal)
Breakout Down (range broken, regardless of signal)
BEST PRACTICES
Recommended Usage:
Focus on highly liquid instruments with tight spreads
Use 1-5 minute charts for entry precision
Respect calculated stop losses (range defines maximum risk)
Typically 1-2 quality setups per day maximum
Consider overall market trend (SPY/QQQ direction)
Risk Considerations:
Very small ranges (< 0.3x ATR) prone to false breakouts
Very large ranges (> 2x ATR) may indicate gap day requiring adjusted expectations
Low volume breakouts fail more frequently
Avoid trading both directions on same day (pick strongest setup)
IMPORTANT DISCLOSURES
This indicator is provided free and open-source for educational purposes. The Opening Range Breakout strategy is a well-documented public domain trading concept. This implementation adds automation, visual clarity, and optional confluence filters.
No indicator guarantees profitable trades. Past performance does not predict future results. Traders are responsible for their own trading decisions and risk management. Always use appropriate position sizing and never risk more than you can afford to lose. インジケーター

Timeframe-Independent Anchored VWAPAn anchored VWAP (Volume Weighted Average Price) that produces identical values (down to the tick!) across different timeframes (unlike, for example, TradingView's built-in Anchored VWAP).
Advantages
This indicator calculates identical values whether you view it on 1m, 5m, 15m, or any other timeframe within reasonable ranges. Even challenging non-integer timeframe ratios like calculating on 2m while viewing on 3m are handled perfectly. In High or Low mode, VWAP will anchor precisely at the selected candle's high/low. As usual for AVWAP, up to 3 standard deviation bands are supported.
How to Use
Setting the Anchor: When the indicator is added, select your anchor time. This is typically placed at a significant swing high/low or session open.
Source Selection: Choose whether to anchor from High, Low, or Close price.
Calculation Timeframe: Select the timeframe used for VWAP calculation.
For intraday trading (1m-1H charts): Just keep the default setting (1m)
For swing trading (4H-D charts): Use 5m or 15m calculation timeframe
For position trading (D-W charts): Use 1H calculation timeframe
Important: Lower calculation timeframes provide more precise data but may hit Pine Script's bar limit on very long timeframes
Standard Deviation Bands: Enable additional band sets as needed for your trading style.
Technical Implementation
The indicator achieves timeframe independence through the following algorithm:
Lower Timeframe Sampling: Uses Pine Script's request.security_lower_tf() to retrieve bar data at the specified calculation timeframe, regardless of the viewing timeframe. This provides consistent data resolution across all chart timeframes.
Anchor Detection: Scans the lower timeframe data to identify the exact bar containing the selected anchor price. The algorithm handles both simple cases (where anchor falls on a complete bar) and complex cases (where anchor falls within a split bar in non-integer timeframe ratios like calculating on 2m while viewing on 3m).
FIFO Buffer Management: Maintains a First-In-First-Out buffer of lower timeframe bars. On each chart bar:
Adds new lower timeframe bars to the buffer
Processes exactly one period worth of bars (matching the viewing timeframe)
Removes processed bars from the buffer
This approach ensures consistent calculation regardless of viewing timeframe.
First Bar Initialization: On the anchor bar, processes only the single anchor bar to ensure the VWAP starts exactly at the anchor price. Subsequent bars process the full period, maintaining mathematical accuracy.
VWAP Calculation: Applies the standard volume-weighted average price formula:
VWAP = Σ(Price × Volume) / Σ(Volume)
StdDev = √(Σ(Price² × Volume) / Σ(Volume) - VWAP²)
All calculations accumulate from the anchor point forward.
Visual Continuity: For edge cases where the anchor falls in an incomplete bar (e.g., calculating on 2m while viewing on 3m), displays the anchor price as a visual placeholder until the actual calculation begins on the next bar. This ensures the line always starts visually at the anchor point. インジケーター

Cross-Exchange VWAP with VAH/VALThis indicator calculates a cross‑exchange VWAP by aggregating price and volume data from up to four major crypto exchanges: Coinbase, Binance, Bybit, and OKX.
It also derives Value Area High (VAH) and Value Area Low (VAL) using a volume‑weighted standard deviation around VWAP.
What this indicator does
Aggregates price × volume and volume from multiple exchanges for the same asset
Calculates a single, unified VWAP reflecting broader market activity rather than a single venue
Computes VAH and VAL as:
VAH = VWAP + k × σ
VAL = VWAP − k × σ
where σ is the volume‑weighted standard deviation and k is user‑configurable
Exchanges supported
Coinbase (default quote: USD)
Binance (default quote: USDT)
Bybit (default quote: USDT)
OKX (default quote: USDT)
Each exchange can be enabled/disabled individually, and symbol overrides are supported (e.g. BTCUSDT, BTCUSDT.P, ETHUSD).
VWAP anchoring options
You can choose how VWAP and Value Area reset:
Daily (UTC session)
Weekly
Monthly
None (fully cumulative)
Manual reset via input toggle
This makes it suitable for intraday, swing, and higher‑timeframe analysis.
Value Area configuration
Standard deviation multiplier (k) is configurable
k = 1.0 → ~68% band (default)
k ≈ 1.036 → ~70% band (normal assumption)
Optional shaded VAL–VAH area for quick visual context
Note: VAH/VAL are derived from VWAP ± σ, not from a full volume‑profile histogram.
This approach is computationally efficient and stable for real‑time trading.
Optional status table
An optional table (top‑right) displays:
Enabled exchanges
Active trading pairs per exchange
Volume availability status
Useful for quickly validating data coverage.
Intended use cases
Institutional‑style VWAP analysis across venues
Reducing single‑exchange bias in crypto trading
Identifying fair value, mean reversion zones, and acceptance areas
Intraday execution and swing trade context
Notes & limitations
Availability of symbols may vary by exchange
(use symbol overrides if needed)
Crypto sessions are UTC‑based for daily resets
Not a true Market Profile / volume‑at‑price VA calculation インジケーター

NY VWAP 2std to 3std Probabilities + Exit ZonesHow it works:
Time buckets
Early: 10:30 – 12:00
Mid: 12:00 – 14:00
Late: 14:00 – 16:00
Bands
2σ band (s2up / s2dn) → this is where the “potential breakout” starts.
3σ band (s3up / s3dn) → this is the “target” for the 2→3σ move.
Counting logic
If during a given bucket, the price touches the 2σ band, it counts as a 2σ hit.
If after that, in the same bucket, the price also touches the 3σ band, it counts as a 3σ hit.
Probability calculation
\text{Probability 2→3σ} = \frac{\text{# of 3σ hits}}{\text{# of 2σ hits}} \times 100
For example, if in the late session the lower 2σ band is hit 10 times, and of those 10 times, 6 eventually hit the lower 3σ band, the script will show 60%.
Labels / lines
On the chart, Upper/Lower 2→3σ probabilities are displayed per bucket.
So yes: “Late Lower 2σ → 3σ: 60%” means: if price touches the lower 2σ band in the late session, historically, 60% of those touches continued to the 3σ band.
⚠ Important caveats:
These are historical probabilities, not predictions.
Small sample sizes in a bucket can make percentages unstable early in the day.
The script only counts session NY bars (0930–1600) and ignores pre-10:30 hits to reduce opening volatility noise. インジケーター

インジケーター

インジケーター

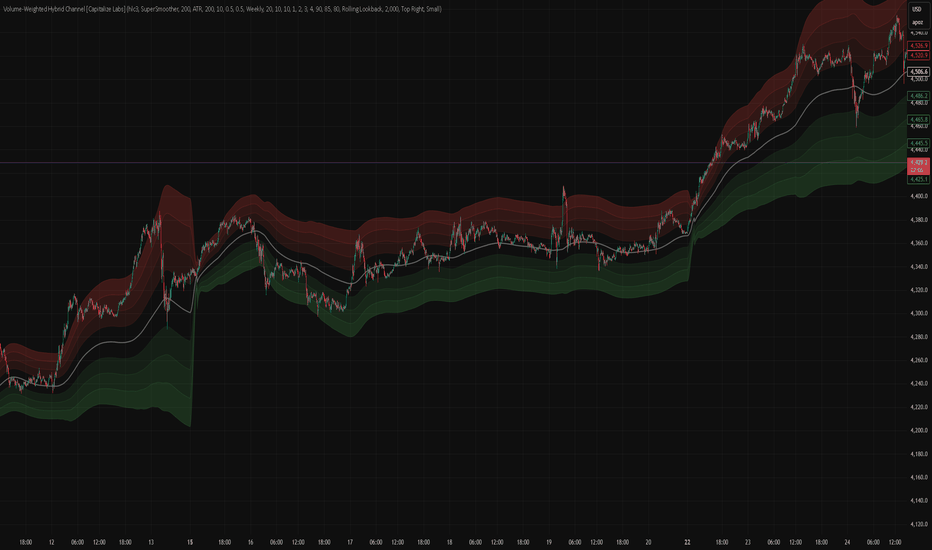
Volume-Weighted Hybrid Channel [Capitalize Labs]Volume-Weighted Hybrid Channel (VWHC) is a channel-only indicator designed to visualise mean and volatility structure using a blended framework. It combines a configurable mean engine (SuperSmoother, EMA, SMA, or RMA) with an anchored VWAP component, then builds a four-level band ladder around a hybrid mean using a hybrid width that blends a range engine (ATR or true range variants) with anchored, volume-weighted standard deviation. The result is a smooth, adaptive channel intended to help us contextualise price location and volatility expansion or contraction relative to the hybrid mean.
The indicator supports Weekly or Session anchoring for the VWAP and sigma components, and includes optional transition smoothing after anchor resets to reduce visual stepping. Band levels are user-defined (with automatic ordering enforcement), and optional gradient fills can be enabled for clearer zone recognition. An optional Band Occupancy Table is included to show how frequently price closes inside each zone, either over a rolling lookback or since the most recent anchor reset. This table is informational only and does not generate signals.
This script is an indicator, not a strategy. It does not place trades, generate alerts, or provide entry or exit instructions. Outputs depend on chart symbol, timeframe, and data quality, including volume availability. The channel is designed to be non-repainting in the sense that it uses confirmed bar data and does not use forward-looking logic; however, like all indicators, the current bar can update until it closes.
Risk Warning
This material is educational research only and does not constitute financial advice, investment recommendation, or a solicitation to buy or sell any instrument. Foreign exchange and CFDs are complex, leveraged products that carry a high risk of rapid losses; leverage amplifies both gains and losses, and you should not trade with funds you cannot afford to lose. Market conditions can change without notice, and news or illiquidity may cause gaps and slippage; stop-loss orders are not guaranteed.
The analysis presented does not take into account your objectives, financial situation, or risk tolerance. Before acting, assess suitability in light of your circumstances and consider seeking advice from a licensed professional. Past performance and back-tested or hypothetical scenarios are not reliable indicators of future results, and no outcome or level mentioned here is assured. You are solely responsible for all trading decisions, including position sizing and risk management. No external links, promotions, or contact details are provided, in line with TradingView House Rules.
Disclaimer
Use of this indicator is at our own discretion and risk. It is a visual analysis tool and should be validated through independent testing and a documented trading plan before being used in live decision-making. インジケーター