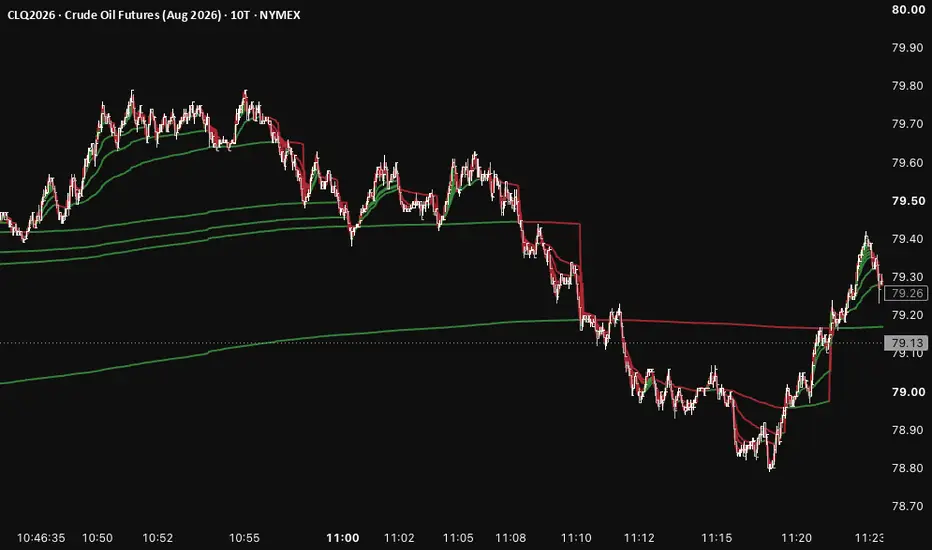
Multi-Period VWAP (7D / 30D / 90D)This indicator plots three rolling Volume-Weighted Average Price (VWAP) lines calculated over trailing 7-day, 30-day, and 90-day windows, giving you a read on where price sits relative to volume-weighted "fair value" across short, medium, and long-term horizons.
Unlike a standard anchored VWAP that resets to zero at a fixed point (session, week, month), these lines are true rolling averages — they continuously reflect the most recent N days of trading and shift smoothly bar to bar, making them useful for spotting mean-reversion zones, confluence with order blocks/key levels, and gauging trend strength when the shorter VWAP is stacked above or below the longer ones.
Features:
- Adjustable lookback lengths for all three periods (defaults: 7 / 30 / 90 days)
- Toggle each VWAP on/off independently
- Customizable colors per line
- Choice of price source (HLC3, Close, or OHLC4)
- Optional "confirmed bars only" mode to prevent the lines from repainting as the current day's volume accumulates
- Live value labels on the last bar for each active VWAP
Built with crypto's 24/7 markets in mind, so the daily boundaries used for the rolling calculation aren't disrupted by traditional session gaps. インジケーター

Rolling VWAP with SignalsRolling VWAP with Signals
Overview
Rolling VWAP with Signals plots a time-window ("rolling") VWAP with standard deviation bands, and generates filtered buy/sell signals on band breakouts. Unlike a session VWAP, which resets at a fixed anchor such as the start of day or week, this VWAP recalculates continuously over a trailing window that you define, for example the last 10 hours or the last 2 minutes of 3-minute bars. This keeps it adapting on any chart, in any session, in any market, including markets that trade around the clock.
This script is an original extension built on the rolling VWAP concept from Rolling VWAP . It adds standard deviation bands, trend-state coloring, crossover based buy/sell signals, an ATR rising filter, and a VWAP trend-alignment filter, none of which are present in the original.
How It Works
The rolling VWAP is computed by summing price times volume and volume over a trailing time window, then dividing, the standard VWAP formula applied to a moving window instead of a fixed session. The calculation runs on an independent timeframe set by the RVWAP Timeframe input, evaluated with request.security().
Standard deviation bands sit above and below the VWAP at a configurable multiple of the rolling standard deviation, computed with the direct weighted squared deviation method rather than the E minus E ^2 shortcut, which avoids precision loss on high-priced instruments.
smoothedATR = ta.swma(ta.atr(atrLength))
atrRising = not useATRFilter or smoothedATR > smoothedATR
Trend state is bullish when the VWAP is higher than it was one higher-timeframe bar ago and price is above the upper band, and bearish under the mirrored condition. The VWAP line is colored accordingly.
Buy and sell signals fire once, on the bar where price crosses a band, not on every bar price remains outside it:
Buy — close crosses over the upper band
Sell — close crosses under the lower band
Two optional filters narrow signals to higher-conviction setups:
Rising ATR — requires an SWMA-smoothed ATR to be higher than the prior bar, filtering out breakouts occurring while volatility is contracting
RVWAP trend alignment — requires the bullish or bearish trend state described above, so buy only fires in an established uptrend and sell only in an established downtrend
Four alert conditions are available: price above the upper band, price below the lower band, a buy signal, and a sell signal.
Inputs
RVWAP Timeframe — Timeframe the rolling VWAP and standard deviation calculation runs on, independent of the chart timeframe. Default: 1 minute.
RVWAP Time Period (Hours / Minutes) — Length of the trailing window used for the rolling calculation. Shorter windows track faster; longer windows behave more like a session VWAP. Default: 0 hours, 1 minute.
Standard Deviation Multiplier — Distance of the bands from the VWAP, in standard deviations. Lower values give tighter bands and more signals; higher values give wider bands and fewer, stronger signals. Default: 1.618.
Show Standard Deviation Bands — Toggles the band plots and disables buy/sell signals when off, since signals require a band cross. Default: on.
Show Fill Between Bands — Toggles the shaded fill between the upper and lower bands. Default: on.
Smooth VWAP/StdDev — Applies additional smoothing to the VWAP and standard deviation lines for a less-lagged appearance when off, or a smoother, laggier line when on. Default: off.
Require Rising ATR for Signals — Gates buy and sell signals on a rising smoothed ATR. Default: on.
Length — ATR length used by the rising-ATR filter. Default: 14.
Require RVWAP Trend Alignment for Signals — Gates buy signals on a bullish RVWAP trend and sell signals on a bearish RVWAP trend. Default: on.
Upper Band, Lower Band, Fill — Colors for the band lines and the fill between them.
Usage Notes
Requires a data feed that provides volume; the script raises a runtime error if none is available.
The rolling calculation needs a minimum of 10 bars within the window to produce a value; very short windows on sparse data may show gaps.
Rising ATR means the current SWMA-smoothed ATR value is strictly greater than the previous bar's value, a one-bar comparison rather than a multi-bar slope.
Values inside the current, still-forming RVWAP Timeframe bar can update intrabar, as with any request.security() call without a fixed historical offset. Confirmed bars do not repaint.
Disable both signal filters to see every raw band-crossing signal, or enable them independently to trade off signal frequency against signal quality.
Credits
Rolling VWAP methodology adapted from the original Rolling VWAP .
Uses the open-source PineCoders ConditionalAverages library for the windowed total calculations.
Disclaimer
This script is provided for educational and informational purposes only and does not constitute financial advice. Past performance is not indicative of future results. Always do your own research and apply proper risk management before trading.
インジケーター

Gravity Bands [JOAT] Price orbits value. An anchored VWAP core with true volume-weighted deviation shells, on clean monochrome candles.
◆ WHAT IT IS
Gravity Bands treats fair value as a gravity core that price orbits and keeps returning to. The core is an anchored VWAP , and the bands around it are true volume-weighted standard deviations — not simple percentage or ATR envelopes. A signature "Lunar Mono" candle mode repaints the chart in clean white/grey so the gravity field is the only color on screen. It is a pure context tool with no buy/sell signals.
This is 100% original code, written from scratch. It is not a repackaged VWAP or bands script.
◆ HOW IT WORKS
1. The gravity core. A volume-weighted average price is accumulated from a chosen anchor — Session, Week or Month — resetting each new period. This is the center of value that price gravitates toward.
2. Volume-weighted shells. The bands are computed from the volume-weighted variance of price around the core, giving genuine ±1σ, ±2σ and ±3σ deviation shells. Because they are volume-weighted, the shells reflect where real activity occurred, not just where price ranged.
3. Stretch. The core distance is expressed in sigma — how many standard deviations price has escaped value. Small stretch means price is orbiting fair value; large stretch means it is extended and statistically stretched from the mean.
4. Lunar Mono candles. An optional mode repaints candles in white (up) and slate grey (down) so the colored gravity field reads instantly without competing with candle colors — the signature look of this tool.
◆ WHAT YOU SEE
• The gravity core (anchored VWAP) with a soft ±1σ / ±2σ / ±3σ gravity field
• Optional Lunar Mono monochrome candles
• An extreme-stretch background wash when price escapes the outer shell
• A resizable dashboard showing the core value, the stretch state and an orbit gauge, the upper and lower shell prices, the 1σ width in price and as a percent, the anchor mode, and a volume-feed check
◆ HOW TO USE IT
• Treat the core as the day's (or week's/month's) fair value — a magnet price often reverts to.
• Use the shells as objective stretch zones: reaching ±2σ or ±3σ marks a statistically extended condition where mean-reversion or exhaustion becomes more likely.
• Reclaiming or losing the core is a simple bias flip .
• Match the anchor to your horizon — Session for intraday, Week/Month for swing context.
• Requires a symbol with a real volume feed.
◆ NOTES & LIMITATIONS
Gravity Bands needs a genuine volume feed — without one the core approximates price and the shells lose meaning (the dashboard flags this). Deviation shells describe statistical stretch, not direction: price can stay extended in a strong trend. It is a context tool, not financial advice. Use it with your own method and risk management.
— made with passion by officialjackofalltrade
インジケーター

Modern VWAP [GBB]What does VWAP actually mean on an asset that never closes?
That question is why I decided to give the good old VWAP a bit of an update for 2026 markets. VWAP is the average price actually paid since some starting point — the anchor. On stocks the anchor is obvious: the opening bell. Bitcoin has no bell. What your chart calls
"the session" is midnight UTC — a timezone convention, not a market
event.
Modern VWAP is an anchored VWAP with sigma bands that anchors itself, runs up to three instances at once, and only fires each signal family in the regime that family was designed for.
THE FOUR LAYERS
L0 — Baseline. VWAP of hlc3 accumulated from the anchor, with bands at one, two and three sigma, where sigma is the volume-weighted deviation of price around the VWAP itself — not a standard deviation of closes. On the same anchor this matches TradingView's built-in VWAP.
L1 — Auto-anchoring. This replaces the click-to-anchor workflow. Anchors are either periodic — Session, Week, Month — or Swing, which re-anchors at a confirmed pivot high or low (pivot length 10 by default, 5 to 50). When a pivot confirms, the accumulators are rebuilt from the pivot bar itself, so the swing VWAP includes the heavy volume around the turn instead of starting after it. Composite mode runs up to three anchored VWAPs together.
L2 — Adaptive bands. The sigma multiplier is scaled by the Kaufman Efficiency Ratio: choppy tape widens the bands, trending tape tightens them. Off by default.
L3 — Regime-gated signals. A KER and ATR quadrant decides whether the tape is trending or ranging, and each family only fires in its own regime. Mean reversion fires in ranging only: price closes outside the two-sigma band, then closes back inside — inside both bands, so a
candle that crosses the entire channel fires nothing. Trend continuation fires in trending only: a pullback to VWAP that holds within three bars. Direction comes from side occupancy, 8 of the last 10 closes above or below VWAP, deliberately not from VWAP slope.
HOW TO READ THE CHART
Instance A is the one that matters. Its line, its bands, and its colour: the band colour is the regime readout. Purple is trending, yellow is ranging, grey is undefined and still warming up.
Instances B and C are context. They draw their VWAP line and the two-sigma pair only, in their own colours, so a weekly or swing anchor can sit behind your primary one without burying the chart.
Signals are labelled: MR pills for mean reversion, TC triangles for trend continuation, green for long and red for short, on confirmed bars only. There are four alert conditions, one per family.
One thing to know: the signals and the regime colour always read Instance A, whatever B and C happen to be anchored to.
SETTINGS
Composite — turn instances A, B and C on or off, each with its own anchor: Session, Week, Month or Swing. Defaults are A on Session, B on Swing, C off on Week.
Swing pivot length — 10 by default, range 5 to 50. Longer means fewer and larger swings, and a longer confirmation lag.
KER-adaptive bands, and KER weight — the L2 toggle, off by default, weight 0.5 on a 0 to 1 range.
Signal markers — turn the markers off and keep the alerts.
Colours — seven inputs. The defaults are tuned for a dark chart; adjust the accents if you trade on white.
Parity mode — leave this off. It replaces the display with the raw numeric fields I used to verify the Pine build against my reference
If you are starting out: leave everything at defaults.
インジケーター

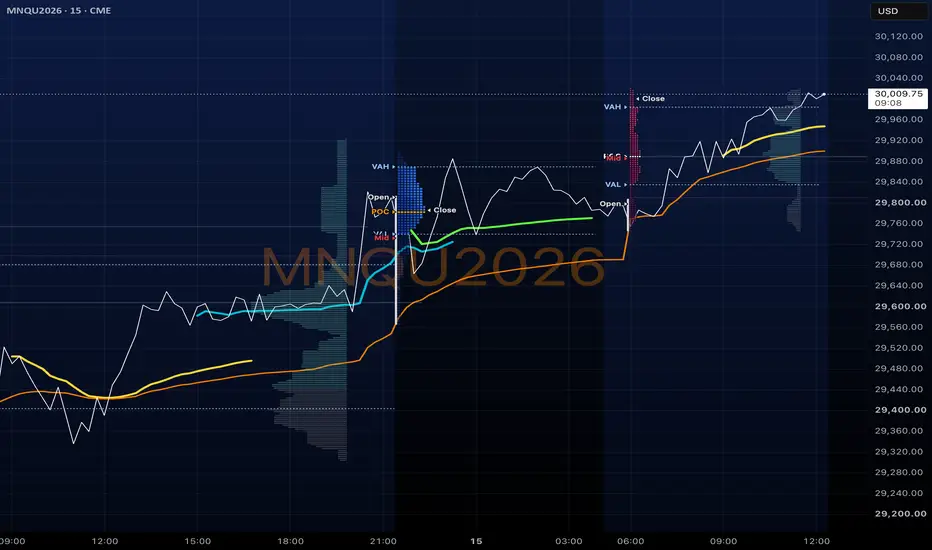
Rogue VP ProRogue VP Pro is an advanced Previous Day Volume Profile indicator built for traders who rely on volume-based market structure to identify high-probability trading opportunities.
The indicator generates a detailed volume profile from the previous trading session and projects the most important price levels onto the current session, providing a clear framework for identifying support, resistance, acceptance, rejection, and potential liquidity areas.
Designed for intraday traders, Rogue VP Pro offers extensive customization while remaining lightweight and easy to read.
Features:
Previous Day Volume Profile
High-resolution volume profile with configurable calculation and rendering density.
Displays the previous session's volume distribution directly on the current trading day.
Supports:
Regular Trading Hours (RTH)
Previous Overnight Session
All Sessions
Automatically calculates and plots:
• Point of Control (POC)
• Value Area High (VAH)
• Value Area Low (VAL)
Optional labels display the exact price of each level.
Value Area Deviations
Project customizable deviation levels above and below the Value Area, allowing traders to identify potential extension targets and exhaustion zones.
Default deviation levels include:
• ±0.25 VA
• ±1.0 VA
• ±2.0 VA
Volume Nodes
Automatically identifies:
• High Volume Nodes (HVNs) – areas of heavy participation
• Low Volume Nodes (LVNs) – potential rejection or low-liquidity zones
Detection sensitivity and filtering thresholds are fully customizable.
Volume Surge Highlights
Identify unusually high-volume bars during Regular Trading Hours.
Bars exceeding a user-defined multiple of average volume are highlighted, making it easy to spot institutional participation and momentum events.
EMA Overlay
Includes an optional Exponential Moving Average for additional trend confirmation and trade confluence.
Customizable Appearance
Customize nearly every aspect of the indicator, including:
• Profile colors
• Value Area colors
• Node colors
• Deviation colors
• Line widths
• Label visibility
• Profile placement (left or right)
• Profile width and rendering resolution
Alerts
Create TradingView alerts whenever price touches one of the key Previous Day Volume Profile levels:
• POC
• VAH
• VAL
Alerts are limited to Regular Trading Hours for more relevant intraday notifications.
Ideal For
• Futures traders
• Index traders
• Options traders
• Scalpers
• Day traders
• Volume Profile enthusiasts
• Price Action traders
How It Can Be Used
Many traders use previous session volume information to:
• Identify high-probability support and resistance
• Monitor acceptance versus rejection around key value areas
• Locate potential breakout and reversal zones
• Trade rotations back toward the Point of Control
• Find confluence with other technical tools and market structure
Rogue VP Pro provides these important reference levels in a clean, highly configurable format, allowing traders to integrate volume profile analysis into virtually any trading strategy.
Disclaimer: This indicator is intended as a market analysis tool and should be used alongside sound risk management and your own trading plan. インジケーター

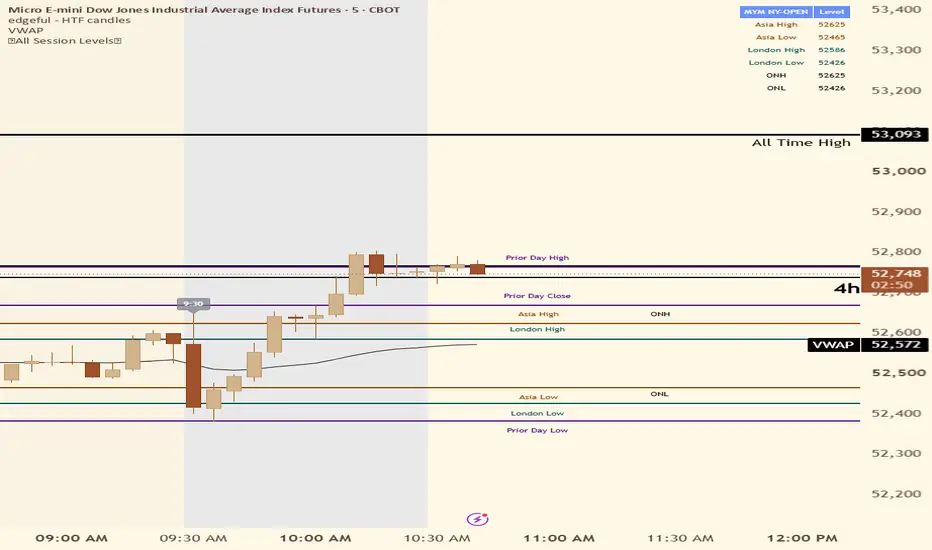
All-In-One Trader Toolkit# All-In-One Trader Toolkit (AIO Toolkit)
A comprehensive overlay indicator that combines the key tools intraday futures traders need into a single script. Designed for ES, NQ, and other futures instruments with all sessions anchored to New York (Eastern) time.
## Features
**Supply & Demand Zones**
Auto-detected zones scored 1–10 based on impulse strength vs. basing range. Zones auto-extend until price closes through them (or use a fixed bar width). Filter by minimum score to show only the strongest levels. Fully customizable colors.
**Previous Day High/Low (PDH/PDL)**
Automatically plots the prior trading day's high and low as dashed reference lines. Configurable number of days to keep on chart.
**Pre-Market High/Low (PMH/PML)**
Captures the high and low of the overnight/globex session. Default session is 6:00 PM – 9:30 AM ET (full globex), adjustable to any window (e.g. 4:00 AM – 9:30 AM for London open only).
**15-Minute Opening Range Breakout (ORB)**
Plots the 9:30–9:45 AM ET opening range high/low. Generates BUY/SELL signals on breakout retests. Includes three configurable take-profit levels with optional symbol-specific points for NQ and ES.
**Daily VWAP + ±1 Standard Deviation Bands**
Manually calculated VWAP with upper and lower bands, resetting each trading day.
**NY-Open Anchored VWAP + ±1 Standard Deviation Bands**
Session-only VWAP anchored to the 9:30 AM NY open. Plots only during the 9:30–4:00 PM session with no carryover lines between sessions.
**Initial Balance (IB) + Extensions**
Captures the first 60 minutes of the NY session (9:30–10:30 AM ET). Plots IB High/Low with 50% and 100% extensions in both directions.
**News / Event Markers**
Up to 3 configurable event markers with custom labels and timestamps. Draws vertical dashed lines at the specified times.
**Dual EMA**
Two independent EMAs with adjustable length, color, and line width. Defaults: 8 EMA and 200 EMA.
## Display
- All labels are pinned to the right edge of the chart for easy identification
- Global label size control (tiny / small / normal / large / huge) applies to all elements
- Every feature can be toggled on/off independently
- All colors are fully customizable through the settings panel
## Alerts
Built-in alert conditions for ORB breakouts (up/down) and retest buy/sell signals.
## Best Used On
Intraday futures charts (1-min, 2-min, 5-min) for instruments like NQ, ES, YM, RTY. Works on any symbol but session times are optimized for US equity futures. インジケーター

BBG Trap Score Indicator=================================================================
Trap Score - Institutional Liquidity & Trapped Trader Index
=================================================================
DESCRIPTION:
The Trap Score Index is a quantitative, non-repainting trading indicator designed to detect inducement, liquidity sweeps, trapped buyers, trapped sellers, absorption, and failed breakouts near key higher-timeframe (HTF) level locations.
Rather than relying on subjective pattern recognition, this tool translates order flow dynamics and price action into a deterministic 0 to 100 Trap Score computed at the close of every candle.
CORE CONCEPT:
Markets frequently generate fake breakouts beyond key swing highs and lows to trigger retail stop orders and attract aggressive breakout traders into illiquid positions. When institutional participants absorb these breakout orders, price fails to advance and reclaims the broken level, leaving retail traders trapped.
This indicator calculates two independent normalized metrics:
• 🟥 Bearish Trap Score: Measures trapped buyers at key resistance ➔ Short Setup
• 🟩 Bullish Trap Score: Measures trapped sellers at key support ➔ Long Setup
11 QUANTITATIVE SCORING FACTORS (100 Points Max):
Each candle evaluates 11 weighted mathematical conditions to build the 0–100 score:
1. Liquidity Sweep at Level (15 pts): Candle wicks past an N-bar swing level and closes back inside with wick ratio ≥ 35% and sweep distance ≤ 0.50 ATR.
2. Failed Breakout / Reclaim (15 pts): Price traded outside a key level and failed to hold outside within 3 bars.
3. Extreme Delta (10 pts): Intrabar volume delta ≥ 2.0× its 20-period average.
4. Volume Expansion (10 pts): Candle volume ≥ 1.5× its 20-period SMA.
5. Absorption (15 pts): Extreme volume/delta expansion accompanied by minimal price progress (≤ 0.15 ATR).
6. Delta-Price Divergence (10 pts): Volume delta achieves a new 5-bar extreme while price close fails to confirm.
7. Large-Trade Absorption (10 pts): Extreme volume spike (≥ 2.5× average) with a large wick (≥ 40%) and price progress ≤ 0.15 ATR.
8. HTF Location Proximity (10 pts): Current price within 0.15 × HTF ATR of HTF Swings, Previous Day High/Low (PDH/PDL), Previous Week High/Low (PWH/PWL), or Session VWAP.
9. VWAP / Value Area Rejection (5 pts): Rejection wick crossing Session VWAP or ± 1 stddev bands.
10. Confirmation Candle (5 pts): Candle close confirming directional momentum past the sweep range.
11. Exhaustion (5 pts): 3 consecutive bars of declining volume with narrow candle range (< 0.50 ATR).
HOW TO TRADE WITH TRAP SCORE:
1. Conviction Tiers & Signal Thresholds:
• Score < 50: Neutral / No Trade
• Score 50 – 64: Low Conviction (Observe)
• Score 65 – 79: Standard Setup (Default Alert Trigger)
• Score 80 – 89: High Conviction Setup
• Score ≥ 90: Exceptional Setup
2. Entry Rules:
• Enter on the open of the bar following a confirmed signal candle where Trap Score ≥ 65.
• Ensure market has not established acceptance outside the swept reference level.
3. Stop Loss Placement:
• Long Position: Sweep Low - (ATR × 0.10)
• Short Position: Sweep High + (ATR × 0.10)
4. Profit Targets (Partial Scale-Out):
• TP1 (50%): At 1.0R or Session VWAP (Move stop loss to Breakeven).
• TP2 (25%): At range midpoint or opposing value area.
• TP3 (25%): At opposing liquidity pool (PWH for longs, PWL for shorts) or 3.0R.
KEY SETTINGS & CUSTOMIZATION:
• HTF Resolution: Higher timeframe context resolution (Default: 240 / 4H).
• Swing Lookback: Number of bars to confirm reference highs and lows (Default: 20).
• Minimum Entry Score: Configurable signal score threshold (Default: 65).
• Dashboard Table: Toggleable top-right status summary panel displaying live scores, conviction levels, sweep states, and signals.
NON-REPAINTING GUARANTEE:
This indicator uses strict non-repainting Pine Script v6 syntax. Higher timeframe security requests fetch only closed completed bars (lookahead = barmerge.lookahead_off) to prevent lookahead bias or hindsight repainting.
インジケーター

Multi-Anchor_VWAP & Deviation Bands [AFD]
Three anchored VWAPs on one chart, with the price zones where they agree shaded in for you.
WHAT IT IS
An anchored VWAP shows the average price everyone has paid since a moment you pick - the gap open, the earnings bar, the swing low that started the move. That is where buyers from that moment sit at break-even, which is why price keeps coming back to it.
One anchor answers one question, so most traders end up dropping three or four by hand and dropping them again every session. This runs three at once: each anchors where you want, each carries its own deviation bands, and the script shades the zones where two of them line up.
THE CONFLUENCE SHADING
Look at this first. It does work you would otherwise do by eye.
When your session VWAP and your weekly VWAP arrive at the same price, that price is being watched by two different groups at once. Those levels tend to matter more than either line alone, and with three curves running they are easy to miss.
The script shades between any two layers that come within your tolerance of each other - on by default at 8 points, and it checks all three pairings, 1 to 2, 1 to 3 and 2 to 3.
Set the tolerance in ticks, points, currency, or percent of price. Trading more than one instrument, use percent: it is the only one you never have to re-tune when you change symbol.
THE ANCHORS
Ten per layer, mixed freely.
Set and forget - Session, Week, Month, Quarter, Year. Re-anchors itself every new period.
Pick the bar yourself - Manual timestamp. Type a date and time. This is the one for an earnings bar, a Fed day, a gap.
Let the chart find it - prior-session high or low, confirmed swing high or low. These follow structure so you are not re-anchoring by hand.
Defaults are session and week, the pairing most intraday traders want.
Two things about the structure anchors look broken if nobody warns you:
The curve shows up late. A swing is not a swing until enough bars print after it. At swing length 10 the line appears 10 bars after the pivot, then draws itself back to the pivot where it belongs.
It never rewrites history. When a newer pivot confirms, the layer re-anchors from there forward. Everything already drawn stays put.
THE BANDS
Up to three per layer, each with its own multiple from 0.0 to 10.0. They tell you how stretched price is from that anchored average. Four ways to measure the stretch:
Standard deviation (default) - how far price usually strays from this average. The classic VWAP band.
ATR - sized by recent range instead, so the envelope opens up in fast markets.
Percent of VWAP - a fixed percentage. Same shape on any instrument.
Standard error - starts wide on a fresh anchor and tightens as the window fills.
Type the multiples in, or load a Fibonacci preset: 0.382 / 0.618 / 1.0 for the inner set, 1.0 / 1.618 / 2.618 for the outer.
IT TELLS YOU WHEN IT CANNOT DO ITS JOB
An anchored VWAP can quietly stop being volume-weighted, or stop covering the window you think it does. This one writes it on the layer's own label, and these notes cannot be switched off - they show even with line labels turned off:
"UNWEIGHTED (no volume)" or "N bars unweighted" - the feed gives no usable volume, so this is a plain average, not a VWAP. Most indices and some spot forex. This is the one that matters.
"one bar per session" / "two-bar window" - a prior-session anchor on a daily or higher chart, where it can only ever span two bars.
"clipped to the draw depth" or "segment past the 5,000-bar buffer, not drawn" - the line starts in mid-air because it hit a drawing limit, instead of pretending it reaches further back than it does.
"(retro)" - a structure anchor, found after the fact. "RTH" - regular hours only, which changes what the average is.
A clean chart carries none of these. One showing up means something you could not otherwise see has happened.
SETTING IT UP
Add it. Layer 1 takes the session, layer 2 the week, and the shading marks where they agree.
Want one clean line? Switch layer 2 off. Want a third timeframe? Switch layer 3 on.
Anchoring to an event: Manual timestamp, then the bar's date and time. Anchoring to structure: a confirmed swing or a prior-session extreme.
Running two or three layers, turn on "Show anchor" - once bands overlap, a label naming its starting bar beats one that just says "L2".
84 inputs in seven groups, and anything that does not apply greys itself out.
ALERTS
One alert: VWAP crosses, band crosses, both, or off. Create it in TradingView with "Any alert() function call". It only fires when a bar closes, never mid-bar, so you are not woken up by a wick that gets taken back.
WORTH KNOWING BEFORE YOU USE IT
Structure anchors draw late. That is the trade for anchoring to something only confirmable in hindsight.
History runs 5,000 bars, and draw depth caps how far a line reaches. Hit either and the label says so instead of the line quietly stopping short.
On "Regular hours only" the ATR bands still measure across every bar on the chart, so they use a wider set of bars than the average does.
"Current window only" hides older curves once a repeating anchor has cluttered things up. Fills, the prior-window level and the confluence shading switch off in that mode.
These bands are this script's own definition, not a claim of equivalence with anyone else's bands of the same name.
Not usable in the Pine Screener - the manual anchor needs a time input, and the Screener substitutes its default instead of reading it, so it would anchor from the wrong bar without telling you.
One symbol, one timeframe. No higher-timeframe or cross-symbol requests.
WHAT MAKES IT DIFFERENT
Three genuinely independent anchors - own anchor, own source, own colours, own bands. Not one anchor with presets.
Confluence shading across all three pairings, in four choices of unit.
It anchors to bars it can only recognise after the fact - prior-session extremes and confirmed swings - and back-fills the curve to them. A running-total VWAP cannot reach backwards like that without starting over.
It states its own failure modes on the chart instead of returning a number that is not what its name says.
Four band bases behind one band definition, and Fibonacci ratios as presets on the levels you already have rather than as extra clutter.
Open source under the Mozilla Public License 2.0. インジケーター

Range Breakout Pro [JOAT]═══ RANGE BREAKOUT PRO ═══
Range Breakout Pro is a universal breakout engine. It defines a reference range from the Previous Day , Previous Week , an Initial Balance window, or a Custom Session , draws that range on the chart, and only fires a trade idea when price confirms a close beyond the edge. Every signal is scored 0–10 for conviction and shipped with a full trade plan: stop, three R-multiple targets, and live outcome tracking.
▎ WHAT IT DOES
It turns a simple "price broke the range" event into a structured, filtered, and scored decision. The chosen range basis is projected onto the current period as a box with edge rails and a midline. A confirmed break becomes a clean LONG or SHORT label with a stop, TP1/TP2/TP3 zones, and a running performance panel — all built to keep the chart readable.
▎ HOW IT WORKS
— Range basis : Previous Day / Previous Week project the prior completed period's high-low forward. Initial Balance and Custom Session accumulate the high-low inside a session window (in your chosen timezone) and lock the range at the window close.
— Break detection : a bar must close beyond the range edge, not just wick through it. In direct mode the close must clear the level by a Break Buffer measured in ATR.
— Optional retest : with retest confirmation on, price must break, pull back within a tolerance of the level, then close beyond it again before a signal arms — decisive reversals back through the level cancel the setup.
— Strength score (0–10) : each candidate is graded on candle body dominance, candle range vs ATR, volume vs its average, 3- and 5-bar momentum agreement, penetration depth past the level, RSI posture, higher-timeframe trend alignment, whether it is the first break of the period, and range size vs ADR. The score maps to a ★ rank and a tier from FORMING to ELITE.
— Filters/gates : minimum strength to signal, optional "strong only" threshold, HTF EMA trend alignment (longs above, shorts below), a range-vs-ADR gate (skip ranges too tight or too wide), and a max-signals-per-period cap.
— Trade model : entry at the confirming close. Stop from Structure (opposite range edge), Mid (range midline), or ATR , with an ATR buffer plus min/max risk clamps. Targets are placed at your TP1/TP2/TP3 R-multiples off the measured risk.
— Outcome engine : each trade is tracked bar by bar for TP1/TP2/TP3, stop, or end-of-period flatten, including same-bar stop handling, and the result feeds the stats panel.
— VWAP overlay : session-anchored VWAP with ±1σ bands and an optional ±2σ outer channel, tinted to the side price is trading.
▎ HOW TO USE IT
— Pick the range basis that fits your style: intraday traders often use Initial Balance or Custom Session; swing traders use Previous Day or Previous Week.
— Wait for a LONG / SHORT label. The ★ rank and score tell you how much confluence backed that break — treat higher tiers as higher conviction.
— The entry line is the confirming close, the dashed line is the stop , and the three solid lines are targets tagged 🎯 TP1 , 🥈 TP2 , 🏆 TP3 . The green zone is the reward area; the red zone is risk.
— Use the range box, midline, and rails as context: reclaims of the midline, failed breaks, and edge retests are all readable at a glance.
— Layer the VWAP bands as confluence — breakouts extending away from VWAP with room to the outer channel read differently than breaks stalling into a band.
— Result labels (TP / SL / EOP with the R outcome) close each idea so you can review what worked.
▎ KEY SETTINGS
— Engine : range basis, session timezone, IB / custom windows, retest toggle, break/retest tolerances, max signals per period.
— Strength & Filters : ATR length, minimum score, strong-only threshold, HTF trend alignment (timeframe + EMA length), and the range-vs-ADR gate.
— Trade Model : stop basis and buffer, ATR stop distance, min/max risk caps, TP1/2/3 in R, and how many past trades to keep drawn.
— Visuals : Ice / Emerald / Mono theme, box, rails, midline, measured-move ×1/×2 guides, projection length, label size, and toggles for signal, lines, zones, level labels, and result labels.
— VWAP & Candles : VWAP source, σ multiplier and lookback, outer channel, and optional RSI-gradient candles.
— Dashboard : show/hide, position, text size, and the outcome breakdown row.
▎ DASHBOARD
A chrome-accented panel reports the active range basis, current range size and % of ADR, price vs VWAP (with σ distance), engine status (forming / armed / trade active), the active and last signal with its score, and live stats: win rate , profit factor , average R per trade, long vs short win%, best direction, total signals, current and max streaks, plus an optional TP1/TP2/TP3 · SL · EOP outcome breakdown.
▎ ALERTS
— RBP Long and RBP Short on a confirmed, filtered breakout.
— TP3 Hit , Partial TP (protected exit), SL Hit , and EOP Exit (end-of-period flatten).
▎ NOTES
— Works on any market and any timeframe.
— Higher-timeframe data uses confirmed prior values, so signals are evaluated on bar close and do not repaint after the fact.
— Clean-by-default: measured-move guides, extra rails, gradient candles, and the outer channel all sit behind toggles so you can strip the chart down or build it up.
— Drawn history (ranges and trades) is capped to keep the chart light.
This tool is for research and education only. It is not financial advice. No indicator can predict the future, and any statistics shown reflect historical signals on your chart — past behavior does not guarantee future results. Always do your own analysis and manage your own risk.
Made with passion by JackOfAllTrades ⚡ インジケーター

Smart Swing VWAP (Zeiierman)█ Overview
Smart Swing VWAP (Zeiierman) is an adaptive price-volume tool that automatically selects meaningful swing highs and lows as VWAP anchors. Instead of relying on one fixed swing period, the indicator analyzes five configurable swing scales and ranks their current structure using price movement, volatility, volume participation, swing size, and agreement between scales.
Once the strongest qualifying swing is selected, the indicator builds a decayed, volume-weighted average from that anchor. Recent price and volume receive more influence, while older data gradually loses importance. This allows the VWAP to remain responsive during active markets without becoming excessively noisy during quieter conditions.
Blending multi-scale swing structure with an adaptive VWAP engine creates a dynamic fair-value path that stays connected to current market behavior. This makes trend pullbacks, structural breaks, retests, continuation setups, and mean-reversion areas easier to identify.
Smart Swing VWAP builds upon the foundation of Dynamic Swing Anchored VWAP (Zeiierman) , which introduced swing-based re-anchoring combined with an adaptive, decayed volume-weighted average. This version expands that concept with five-scale swing analysis, matrix-based anchor ranking, anchor quality filters, structural break handling, selectable line behavior, and automated retest detection.
█ How It Works
⚪ Smart Swing Selection
The indicator tracks five swing scales simultaneously. Each candidate is evaluated using cross-scale agreement, swing range, directional progress, volatility expansion, and volume participation.
float sc = 100.0 * (0.25 * cs + 0.20 * rg + 0.55 * en)
Only swings that pass the Minimum Anchor Score, Minimum Move Strength, and Bars Between New Anchors requirements can become the active VWAP anchor. This helps prevent constant re-anchoring during noisy or overlapping market structure.
⚪ Adaptive VWAP
Once an anchor is selected, the script calculates a decayed volume-weighted average. Recent price and volume matter more, while older observations gradually lose influence.
pv := (1.0 - alx) * pv + alx * hlc3 * vi
vv := (1.0 - alx) * vv + alx * vi
vw := vv > 0 ? pv / vv : na
Price Tracking Speed controls the base responsiveness. The optional volatility adjustment compares current ATR with its average, allowing the VWAP to react faster during volatility expansion and move more smoothly during quieter conditions.
⚪ Structure And Line Behavior
After an anchor is accepted, the indicator tracks the strongest opposite swing. A confirmed close through the active structural level changes the bullish or bearish state.
Users can choose between two behaviors:
Recolor Entire Active Line: Keeps one continuous VWAP and recolors the complete active path when structure changes.
Preserve Old Color And Start New Segment: Keeps the previous color visible and begins a new segment from the confirmed structure-break bar.
⚪ Historical Anchor Reconstruction
When a swing wins the ranking process, the indicator rebuilds the active VWAP from the original swing bar. This displays the complete price-volume path that developed from the selected structure point.
The anchor is only accepted after the ranking conditions are confirmed. The reconstructed historical line does not mean the winning swing was known in real time at the original pivot bar.
█ Why This Adaptive Approach Beats a Simple VWAP
Standard anchored VWAP uses one manually selected starting point. Its usefulness depends heavily on whether that anchor remains important as market structure changes.
A cumulative VWAP can also become increasingly resistant to new price information because every historical price-volume observation remains permanently included. During long trends or multi-session moves, this can cause the VWAP to drift far away from the current price.
Smart Swing VWAP addresses these problems in three ways:
⚪ Smart Multi-Scale Anchoring
Instead of using one fixed swing period, the indicator compares several structural horizons.
Shorter scales react to fast local movement, while longer scales identify broader market pivots. The ranking system selects the swing with the strongest combination of agreement, range, movement quality, volatility, and volume participation.
⚪ Decayed Price-Volume Weighting
Older information gradually loses influence instead of remaining permanently dominant.
This allows the VWAP to stay closer to the market’s current perception of fair value and can create more relevant pullbacks and retests than a traditional cumulative VWAP.
⚪ Volatility-Aware Responsiveness
Markets do not move at one constant speed.
High Volatility → faster tracking: The VWAP responds more quickly and remains closer to active price movement.
Low Volatility → smoother tracking: The VWAP filters smaller fluctuations and remains more stable.
Result: A structure-aware VWAP that can adapt its anchor, responsiveness, and directional presentation as market conditions evolve.
█ How to Use
⚪ Trend Trading
During bullish structure, the green VWAP can act as a dynamic support reference. Look for price to remain above the line, pull back toward it, and then show renewed buying pressure.
During bearish structure, the red VWAP can act as a dynamic resistance reference. Look for price to remain below the line, retrace toward it, and then show renewed selling pressure.
█ Settings
Pivot Scales: Enables or disables each swing scale used by the ranking engine. More active scales provide broader structural comparison.
Length: Number of bars used to detect swing highs and lows for each scale. Smaller = faster and noisier; larger = slower and cleaner.
After Structure Break: Chooses whether the entire active VWAP changes color or the previous color is preserved and a new segment begins.
Price Tracking Speed: Sets the base VWAP reaction speed. Lower = faster and tighter to price; higher = smoother and slower.
Adjust Speed With Volatility: When ON, tracking speed automatically adjusts using current ATR relative to its average. High volatility = faster; low volatility = smoother.
Volatility Adjustment Strength: Controls how strongly volatility changes the tracking speed. Higher values = stronger adjustment.
Minimum Anchor Score: Minimum total ranking score required before a swing can become the active VWAP anchor. Higher = fewer, more selective anchors.
Minimum Move Strength: Requires directional progress, volatility expansion, and volume participation before accepting a swing. Higher = stronger moves only.
Bars Between New Anchors: Minimum number of confirmed bars before another swing can replace the active anchor. Higher = fewer anchor changes.
Retest Touch Zone (ATR): Maximum distance from the VWAP that counts as a retest touch. Higher = wider touch zone.
Retest Setup Distance (ATR): Minimum distance price must first move away from the VWAP before a later return can trigger a retest.
-----------------
Disclaimer
The content provided in my scripts, indicators, ideas, algorithms, and systems is for educational and informational purposes only. It does not constitute financial advice, investment recommendations, or a solicitation to buy or sell any financial instruments. I will not accept liability for any loss or damage, including without limitation any loss of profit, which may arise directly or indirectly from the use of or reliance on such information.
All investments involve risk, and the past performance of a security, industry, sector, market, financial product, trading strategy, backtest, or individual's trading does not guarantee future results or returns. Investors are fully responsible for any investment decisions they make. Such decisions should be based solely on an evaluation of their financial circumstances, investment objectives, risk tolerance, and liquidity needs.
インジケーター

VWAP Suite | Trend & Mean Reversion with Adaptive FiltersOverview
This strategy is built around a custom volume-weighted average price (VWAP) engine with standard-deviation bands, and gives you two complete, independently-tuned trading modes in a single script:
Trend Following — trades breakouts/crossovers in the direction of VWAP's own momentum
Mean Reversion — trades stretched price extremes back toward VWAP, filtered for low-trend conditions
Rather than assuming one style of market behavior, this script lets you choose the mode that matches what you're trading — a trending momentum stock, or a calmer range-bound one — and includes a layered filter system designed to keep you out of low-quality setups in either mode.
How VWAP Is Calculated
VWAP weights price by the volume traded at that price, rather than treating all price ticks equally — so it reflects where the real trading activity concentrated, not just a simple average.
This script computes it manually (not via a black-box built-in), which allows for flexible anchoring:
Session — resets daily (best for lower timeframes, intraday charts)
Week — resets weekly (better for 1H–4H charts)
Month — resets monthly (for swing/position-style testing)
Standard deviation bands are plotted at three levels (1, 2, and 3 std dev by default), giving visual reference points for "normal," "stretched," and "extreme" price deviation from the volume-weighted average.
Strategy Modes
Trend Following
Looks for price to break through VWAP (or an outer band) in a direction confirmed by VWAP's own slope — the idea being that VWAP acting as support/resistance and trending in your trade's direction adds conviction to the move.
Three selectable entry triggers: VWAP Cross, Band 1 Break, Band 2 Break
VWAP slope filter (with adjustable lookback and minimum slope %) to avoid trading flat/directionless VWAP
Take-profit targets at the opposite band or at VWAP itself
Best suited for: momentum-driven, higher-volatility names where trends persist once established.
Mean Reversion
Looks for price to overextend beyond a chosen band, then trades the snap-back toward VWAP. Includes an ADX filter to specifically avoid taking reversion trades during strongly trending conditions (where "buying the dip" or "fading the rip" is historically much riskier).
Three selectable entry triggers: Outside Band, Band Cross, Band Reclaim (wick-and-recover confirmation — the most conservative/false-signal-resistant option)
ADX filter caps entries below a configurable trend-strength threshold
Maximum VWAP deviation cap (in ATR units) to avoid catching a falling knife on extreme extensions
Best suited for: range-bound, lower-volatility names where price oscillates predictably around a stable average.
Filter System (False-Signal Reduction)
Every entry — in either mode — passes through a shared base filter layer before mode-specific logic is applied:
Volume Filter: Requires volume above a multiple of its recent average, filtering out low-conviction moves
Volatility (ATR) Filter: Requires a minimum ATR (as % of price) to avoid dead, directionless conditions
Band Width Filter: Avoids trading when bands are unusually tight (a sign of indecision and high whipsaw risk)
VWAP Slope Filter (Trend mode): Confirms VWAP itself is moving meaningfully in the trade direction, not just flat
ADX Filter (Mean Reversion mode): Blocks entries when the broader trend is too strong to safely fade
Each filter can be toggled independently, so you can isolate which conditions matter most for the instrument and timeframe you're trading.
Optional Confluence Layer
A secondary indicator can be layered on top of either mode:
RSI — for trend mode, confirms momentum direction; for mean reversion, confirms oversold/overbought exhaustion via a crossover trigger
EMA Regime (200-period default) — acts as a higher-level trend filter, only allowing longs above the EMA and shorts below it
Risk Management
Risk-based position sizing — position size is calculated from your risk % input divided by stop distance, not a fixed share count
Maximum position size cap (% of equity) — acts as a hard ceiling so tight-stop trades can't produce oversized positions
Two stop-loss methods — ATR-multiple based, or band-based (using the outer bands as structural stop references)
Two take-profit methods — opposite band target, or VWAP itself
Optional fixed take-profit lock — freezes the target price at entry rather than letting it drift with VWAP
Optional break-even stop — moves the stop to entry once a configurable ATR-multiple of profit is reached
Visuals
VWAP line color-shifts between two colors depending on whether price is above or below it
Three-tier shaded band system for at-a-glance visual reference of price deviation
Entry markers (triangle up/down) plotted directly on signal bars
Background shading during filtered/no-trade conditions, so you can visually see why the strategy stayed flat
Important Notes Before Use
Match your anchor period to your timeframe. Session anchoring is built for intraday charts; on higher timeframes (2H+), Week or Month anchoring will produce more reliable slope readings, since Session resets can occur every few bars and distort trend measurement.
Backtest results include commission assumptions but not slippage — adjust the commission/slippage settings in the strategy properties to reflect your actual broker before drawing conclusions from performance metrics.
This script is provided for research and educational purposes. Past performance in backtesting does not guarantee future results. Always forward-test on a paper account before committing real capital. ストラテジー

VWAP Deviation Trend [BackQuant]VWAP Deviation Trend
Overview
VWAP Deviation Trend is a volume-weighted trend-following overlay that transforms VWAP and its surrounding price distribution into a directional trailing structure.
Rather than using VWAP only as a fair-value line, the indicator calculates:
A configurable anchored or rolling VWAP.
The volume-weighted standard deviation of price around that VWAP.
Adaptive upper and lower deviation bands.
One-sided trailing boundaries used to confirm bullish and bearish regimes.
The indicator is designed to identify when price has moved far enough away from accepted volume-weighted value to establish a meaningful directional shift.
Unlike a simple VWAP crossover, price can move through VWAP without immediately changing the active trend. A new regime requires price to break the opposite trailing deviation boundary, optionally with confirmation from the direction of VWAP itself.
The updated visual engine also measures trend strength and uses it to control:
Gradient intensity.
Trail glow width.
Post-flip bloom effects.
The visual separation between price and the active trail.
Core concept
VWAP represents the average price paid over a selected period, weighted by trading volume.
The basic formula is:
VWAP = Sum of Price × Volume / Sum of Volume
Prices associated with greater volume contribute more heavily to the final value. This makes VWAP a useful approximation of:
Volume-weighted fair value.
The center of traded activity.
The average position of market participants.
An institutional execution benchmark.
However, VWAP alone does not explain how widely price has been distributed around that value.
VWAP Deviation Trend treats VWAP as the center of a volume-weighted price distribution and measures the dispersion around it. That dispersion is then used to create trailing trend boundaries.
VWAP calculation modes
The indicator supports five VWAP windows:
4 Hours
Daily
Weekly
Rolling Lookback Bars
Rolling Lookback Days
4 Hours
Resets VWAP at fixed four-hour intervals.
This can be useful for:
Cryptocurrency markets.
Intraday futures.
Continuously traded markets.
Shorter fair-value regimes.
Daily
Resets at the beginning of each calendar day.
This is the traditional intraday VWAP structure and is useful for:
Session bias.
Intraday mean reversion.
Day-trading trend confirmation.
Weekly
Accumulates volume and price across the current week.
This creates a slower structural anchor suited to:
Swing trading.
Weekly positioning.
Broader accepted-value analysis.
Rolling Lookback Bars
Calculates VWAP over a fixed number of candles.
The window moves forward continuously and does not reset at a calendar boundary.
This is useful for:
Systematic trend models.
Consistent multi-timeframe analysis.
Markets where daily sessions are less important.
Rolling Lookback Days
Includes bars that fall within a selected number of calendar days.
This keeps the analytical window tied to elapsed time instead of a fixed candle count.
Anchored versus rolling VWAP
Anchored modes begin at a fixed boundary and accumulate until the next reset.
Rolling modes continually remove old observations as new observations arrive.
Anchored VWAP is useful when a particular session or week has structural meaning. Rolling VWAP is useful when the trader wants a stable and continuously adapting lookback.
Volume-weighted deviation
The indicator calculates more than the VWAP mean.
It also measures volume-weighted price variance using:
Weighted Mean Square = Sum of Price² × Volume / Sum of Volume
Weighted Variance = Weighted Mean Square - VWAP²
Weighted Deviation = Square Root of Weighted Variance
This measures how widely prices associated with meaningful trading volume are distributed around VWAP.
A small deviation suggests:
Trading is concentrated near fair value.
The market is relatively balanced.
Price acceptance is narrow.
A large deviation suggests:
Trading is spread across a wider range.
Price discovery is more active.
The market is less tightly centered around VWAP.
Because the calculation is volume weighted, high-volume prices influence the bands more than low-volume excursions.
Fallback when volume is unavailable
If usable volume is not available, the indicator falls back to an unweighted arithmetic mean and variance.
This allows it to function on synthetic or limited-volume symbols, although the result should then be interpreted as a rolling or anchored mean rather than a true VWAP.
Deviation bands
The raw width is calculated as:
Deviation Width = Weighted Deviation × Deviation Multiplier
The upper and lower raw bands are:
Upper Band = VWAP + Band Width
Lower Band = VWAP - Band Width
Higher deviation multipliers create wider bands and fewer trend changes.
Lower multipliers create tighter bands and faster, more frequent flips.
ATR minimum width
During low-dispersion periods, volume-weighted deviation can become extremely narrow.
This can cause small and insignificant movements to trigger repeated reversals.
The optional ATR floor calculates:
ATR Floor = ATR × ATR Minimum Multiplier
The final width becomes:
Band Width = Maximum of Deviation Width and ATR Floor
This preserves volume-weighted deviation as the primary band engine while preventing the channel from collapsing below a practical volatility threshold.
Trailing-band construction
The raw deviation bands move freely with VWAP and dispersion.
The indicator converts them into one-sided trailing levels.
Lower trail
While the selected trigger remains above the lower trail:
The trail can rise.
It cannot move downward.
This creates a ratcheting support structure.
Upper trail
While the trigger remains below the upper trail:
The trail can fall.
It cannot move upward.
This creates a ratcheting resistance structure.
The active trend trail is:
The lower trail during bullish regimes.
The upper trail during bearish regimes.
Why trailing logic matters
A raw VWAP band can move toward price and create unstable signals.
The one-sided trail preserves trend structure and creates hysteresis.
Hysteresis means the threshold required to enter a bullish regime is different from the threshold required to enter a bearish regime.
This allows price to rotate around VWAP without constantly changing the active trend.
Trend initialization
When the first valid VWAP is available:
The trend initializes bullish if the trigger is at or above VWAP.
The trend initializes bearish if the trigger is below VWAP.
After initialization, a full break of the opposite trail is required to change regimes.
Bullish trend flip
A bullish flip requires:
The selected trigger to move above the upper trailing band.
The current trend not already to be bullish.
VWAP slope confirmation to pass if enabled.
Once confirmed:
The trend becomes bullish.
The active trail moves beneath the market.
A bullish signal marker is displayed.
Bearish trend flip
A bearish flip requires:
The selected trigger to move below the lower trailing band.
The current trend not already to be bearish.
VWAP slope confirmation to pass if enabled.
Once confirmed:
The trend becomes bearish.
The active trail moves above the market.
A bearish signal marker is displayed.
Flip trigger
The trend can be triggered using:
Close
The selected VWAP price source
Close is the more conventional option.
Using the price source, such as HLC3, can produce a slightly smoother trigger because it reflects more of the bar than the close alone.
VWAP slope confirmation
Optional slope confirmation requires VWAP itself to move in the direction of the proposed new trend.
For a bullish flip:
Current VWAP must be above VWAP from the selected lookback.
For a bearish flip:
Current VWAP must be below its prior value.
This can help reject:
Temporary band breaks.
Low-volume price spikes.
Liquidity sweeps against flat fair value.
The tradeoff is additional confirmation delay.
Breaking the trail on flips
The active trail changes from one side of the market to the other during a regime transition.
The Break Trail On Flips option inserts a visual gap on the flip bar so the previous and new trails are not connected by a misleading line segment.
This affects presentation only.
Visual trend-strength engine
The updated script includes a visual-strength model that controls the intensity of the gradient and glow.
It combines two measurements:
Distance between price and the active trail.
Slope of VWAP relative to the current band width.
Distance strength
The script measures:
Absolute Distance = |Close - Trend Trail|
This is normalized by the current band width.
A larger distance indicates stronger separation between price and the structural trail.
Slope strength
VWAP movement across the slope lookback is also normalized by the band width.
This measures whether volume-weighted fair value itself is moving meaningfully relative to the size of the current deviation structure.
Combined trend strength
The final visual strength is weighted:
70% price-to-trail distance.
30% VWAP slope strength.
This produces a value between zero and one.
It does not change trend logic or signals. It controls the visual intensity of the indicator.
Layered gradient fill
Instead of using one flat gradient, the updated indicator divides the space between the trail and price into six visual layers.
The levels are placed progressively between:
The active trend trail.
The current closing price.
The gradient is:
Most concentrated near the structural trail.
Progressively softer toward price.
The opacity adapts to trend strength.
When price is strongly separated from the trail and VWAP is moving with the regime:
The gradient becomes more vivid.
When the trend is weak:
The fill becomes softer and more transparent.
This makes the visual ribbon encode more than direction. It also reflects the current strength of the price-to-structure relationship.
Flip bloom
After a confirmed trend flip, the indicator creates a temporary bloom around the new trail.
The bloom is strongest immediately after the transition and fades over the following bars.
Its intensity follows this general sequence:
First bar after flip: strongest bloom.
Second bar: reduced bloom.
Third bar: light residual bloom.
Afterward: bloom disappears.
This visually emphasizes fresh regime changes without permanently increasing chart brightness.
The bloom is cosmetic and does not affect calculation.
Adaptive trail glow
The glow surrounding the trail also changes with trend strength.
The base width is ATR-scaled, then increases slightly as the visual trend-strength score rises.
This creates:
A broader glow during stronger regimes.
A narrower glow when trend structure is weaker.
The glow contains:
An inner, more visible layer.
A wider, softer outer layer.
Visual interpretation
The updated presentation provides several pieces of information simultaneously:
Color shows the active trend direction.
The trail shows the structural regime boundary.
Gradient intensity reflects trend strength.
Glow width reinforces structural conviction.
The bloom highlights fresh regime transitions.
How to use the indicator
Trend regime filter
Use the active color and trail position as directional context:
Favor longs during bullish regimes.
Favor shorts during bearish regimes.
Pullback structure
In a bullish regime:
VWAP represents volume-weighted fair value.
The lower trail represents deeper structural support.
In a bearish regime:
VWAP represents the mean-reversion anchor.
The upper trail represents deeper structural resistance.
Trend-strength context
A vivid gradient and broader glow suggest:
Price is well separated from the trail.
VWAP is moving in the trend direction.
The regime has stronger structural momentum.
A weak or faded gradient suggests:
Price is closer to the trail.
VWAP slope is weaker.
The trend may be consolidating or losing strength.
Fresh transitions
The bloom helps identify newly established regimes.
A fresh flip with:
Strong bloom.
Growing price separation.
VWAP slope alignment.
generally represents stronger early trend structure than a flip that immediately loses visual intensity.
Dynamic risk management
The active trail may be used as:
A trailing stop reference.
A regime invalidation boundary.
A position-management guide.
Because the trail responds to both volume-weighted dispersion and volatility, it adjusts as market conditions change.
How this differs from a standard VWAP
A standard VWAP:
Plots only volume-weighted mean price.
Usually resets once per session.
Does not maintain trend state.
VWAP Deviation Trend:
Supports anchored and rolling windows.
Calculates volume-weighted dispersion.
Creates adaptive raw bands.
Converts them into directional trailing boundaries.
Maintains persistent bullish and bearish regimes.
Adds a strength-reactive visual system.
How this differs from Supertrend
A traditional Supertrend normally uses a central price such as HL2 and ATR-based bands.
VWAP Deviation Trend uses:
Volume-weighted fair value as the center.
Volume-weighted standard deviation as the primary width.
ATR only as an optional minimum floor.
This means the trail responds not only to range volatility, but also to where trading volume has been concentrated.
How this differs from Bollinger Bands
Bollinger Bands normally use:
A moving average.
Unweighted standard deviation.
Symmetrical non-trailing bands.
This indicator uses:
A volume-weighted mean.
Volume-weighted variance.
One-sided trailing bands.
Persistent trend-state logic.
It is therefore a trend-regime model rather than a standard mean-reversion envelope.
Input guide
VWAP Mode
Selects the anchored or rolling calculation window.
Deviation Multiplier
Controls the width of the statistical bands.
Higher values produce wider, slower regimes. Lower values produce tighter and faster regimes.
ATR Minimum Width
Prevents excessive narrowing during compressed conditions.
VWAP Slope Confirmation
Requires volume-weighted fair value to move with the proposed trend.
Flip Trigger
Selects whether close or the chosen price source must cross the trail.
Visual settings
Allow the trader to display:
The trend trail.
VWAP.
Raw deviation bands.
Layered gradient.
Adaptive glow.
Signals.
Trend candles.
Strengths
Combines fair value, dispersion, and trend structure.
Uses volume-weighted mean and variance.
Supports multiple anchored and rolling VWAP windows.
Uses ATR protection against narrow-band whipsaws.
Creates persistent regimes with hysteresis.
Provides optional VWAP slope confirmation.
Includes a trend-strength-reactive visual system.
Clearly emphasizes fresh trend transitions.
Limitations
Volume quality varies between instruments.
Anchored VWAP modes may be unstable immediately after a reset.
Long windows can react slowly to sudden regime changes.
Tight settings can increase whipsaws.
Wide settings can delay reversals.
Slope confirmation can add additional lag.
Visual strength is contextual and is not a separate trading signal.
Alerts
The indicator includes alerts for:
Confirmed bullish trend flips.
Confirmed bearish trend flips.
These represent complete VWAP deviation regime changes, not ordinary crosses of VWAP.
Summary
VWAP Deviation Trend converts volume-weighted fair value and price dispersion into a directional trend trail.
It calculates VWAP over a configurable anchored or rolling window, measures volume-weighted standard deviation around that VWAP, and builds upper and lower deviation bands. An optional ATR floor prevents the structure from becoming excessively narrow during quiet conditions.
The raw bands are transformed into one-sided trails. The lower trail ratchets upward during bullish regimes, while the upper trail ratchets downward during bearish regimes. Trend changes occur only when price breaks the opposite trail, optionally with confirmation from the slope of VWAP.
The updated visual engine measures price separation and VWAP slope to dynamically control the layered gradient, trail glow, and temporary post-flip bloom. This creates a clearer representation of direction, structural strength, and fresh regime transitions without changing the underlying signal logic. インジケーター

Futures Session TWAP + Bands - CFD ChartsAn anchored TWAP (time-weighted average price) with 1/2/3-sigma bands that
knows when the real market is actually open — built for CFD and cash-index
charts whose 24h quotes distort classic session averages.
What makes it original: a TWAP weighs every bar equally, so on a 24h CFD chart
the thin overnight bars count as much as the liquid session and drag the line
away from the number execution desks reference. This indicator pulls the
volume of the auto-detected futures contract and uses it as a SESSION GATE:
only bars where the future actually traded are counted. It also plots an
optional futures-volume VWAP on the same anchor, so the TWAP-vs-VWAP spread
becomes readable at a glance — that spread is the point of the pair.
How it works:
- TWAP = equal-weight average of the chart's price (hlc3 by default) over the
anchor period (session/week/month); bands from the time-weighted variance.
- Session gate (optional, on by default): bars without futures volume are
skipped, so the TWAP covers the real trading session. Only session/volume
information is borrowed from the future — the price stays this chart's
price, so the futures-vs-cash basis cannot distort the level.
- The futures contract is auto-detected from the chart symbol (DAX/GER40 ->
FDAX, NAS100 -> NQ, US30 -> YM, UK100 -> Z, US500 -> ES), or set manually.
- Optional "Daily anchor = futures trading day" resets at the futures day
change instead of CFD broker midnight, matching the sibling VWAP tool.
- A status label shows the active source, the gate state and the current
VWAP-minus-TWAP spread.
How to use it: the TWAP is the fair time-average of the session — the line an
evenly-sliced execution would achieve. Compare it with the futures-volume
VWAP: VWAP above TWAP means volume was concentrated above the time average
(participants paid up), VWAP below TWAP means volume traded below it. The two
lines glued together signals balanced rotation; a widening spread marks
one-sided participation. The 2/3-sigma bands frame statistically stretched
zones relative to the session mean. Check the status label once after loading
to confirm the futures feed is active.
*This script is part of a consistent set of open-source session, range and
volume tools — the companions are on my profile.* インジケーター

Anchored VWAP Hand-Off 2.03Anchored VWAP Hand-Off 2.03 is a multi-leg cascading VWAP indicator. It starts with a classic Anchored VWAP from a user-selected date (Leg 1), then automatically creates new "hand-off" VWAP legs (up to 24) every time price crosses the previous VWAP. Each new leg resets its calculation from the bar of the cross, creating a dynamic chain of VWAPs that follow price action.
Key Features:
Source: Typically close (customizable).
Trigger: EMA(1) of the source (essentially price itself).
Color Logic: Each VWAP leg changes color based on whether price is above (bullish) or below (bearish) it. Supports unified color mode.
Up to 24 cascading legs (user controls how many are shown).
Visual anchor line at the start date.
Main Use Cases:
Dynamic Support & Resistance
The multiple VWAP legs act as adaptive moving support/resistance zones. Traders watch for bounces off these lines or breaks through several legs at once.
Trend Strength & Momentum
Strong trends often break multiple hand-off legs quickly.
Choppy/consolidating markets produce many frequent hand-offs (more lines clustering).
Mean Reversion Setups
Price tends to return to the nearest active VWAP legs. Useful for fade-the-extreme strategies.
Breakout / Breakdown Confirmation
When price decisively breaks through several VWAP legs in sequence, it often signals a high-probability directional move.
Intraday & Swing Trading
Particularly popular on stocks, futures, and crypto for finding "fair value" shifts after news events or strong moves. The hand-off mechanism makes it more responsive than a single static anchored VWAP.
Visual Market Structure
Helps traders see how "value" is migrating over time as new legs form.
Best Timeframes: Works on all, but especially useful on 5min to daily charts.Pro Tip: Start with 8–12 legs. Too many legs can make the chart noisy. Use the anchor date on significant events (earnings, breakout days, macro events, etc.).This indicator is an evolution of standard Anchored VWAP, designed to solve the problem of a single anchored VWAP becoming stale after big moves.
インジケーター

Institutional VWAP Bands [JOAT]Institutional VWAP Bands
An anchored VWAP with standard-deviation bands that classifies price as cheap, fair or expensive and offers two complementary playbooks: mean reversion and trend pullback.
What it is
VWAP is the benchmark institutions measure their own fills against — the market's running notion of fair value. Standard-deviation bands around it map where price is stretched relative to that benchmark. This indicator runs an anchored VWAP with three band pairs and turns them into a structured, non-repainting decision tool rather than a plain VWAP line.
How it works
• Anchored VWAP — volume-weighted average price accumulated from a chosen anchor (session, week or month) with a controlled reset, so the reference restarts cleanly each period.
• Sigma bands — three pairs of bands at one, two and three standard deviations of price around VWAP, computed from the same volume-weighted variance. These define the stretch zones.
• Value state — every bar is classified with a z-score into cheap, fair or expensive relative to VWAP. This drives the colour system and the dashboard.
• Mean-reversion fades — when price is stretched to the outer bands against the higher-timeframe trend and then reclaims back inside, a fade toward VWAP is signalled. The reclaim requirement is deliberate, so you are not blindly catching a falling knife.
• Trend-pullback entries — in a trend, a retracement to VWAP or the first band that holds is a discount entry in the trend direction. Both playbooks are labelled by type, and Buy/Sell are mutually exclusive with a minimum-gap control.
Trade levels
Each signal draws a red risk box to the ATR stop and a green reward box to the third target, with inner dividers and right-edge labels for entry, stop and each take-profit. For reversion signals the first target is clamped toward VWAP so it always sits on the profit side of entry.
The dashboard
An adjustable value-ladder panel shows the value state, the z-score, the trend bias, the active playbook and signal, a conviction estimate, and a live first-target-before-stop tally from closed bars only.
How to use it
• Choose the anchor that matches your style: session for intraday, week or month for swing context.
• Fade the outer bands only against the trend and with a reclaim; take pullbacks to VWAP with the trend.
• Works across assets and timeframes, though the anchor should suit the timeframe you trade.
Settings
Anchor period, VWAP source, three band multipliers, trend filter length, reversion trigger, ATR risk multiple and target R multiples, plus visual and dashboard controls.
Originality and usefulness
VWAP and deviation bands are standard building blocks; the contribution here is the explicit two-playbook logic (reclaim-based reversion versus trend pullback), the value-state classification that ties colour, dashboard and signals together, and the reversion target clamp — combined into one coherent, non-repainting framework and fully explained.
Notes and limitations
• VWAP is most meaningful on instruments with reliable volume; on symbols without real volume the bands lose accuracy, which is stated here honestly.
• Reversion trades against a strong trend carry inherent risk even with the reclaim filter.
• The tally reflects only past bars on the current chart and is not a forecast.
• Educational and analytical tool, not financial advice.
— made with passion by officialjackofalltrades
インジケーター

Multiday VWAP by ByblloMultiday VWAP by Bybllo
OVERVIEW
This indicator plots up to 5 independent rolling Volume Weighted Average Price (VWAP) lines, each anchored a different number of calendar days back from the present bar (default: 2, 3, 4, 5, and 6 days back). Unlike a standard session VWAP that resets every day, each line here accumulates price*volume continuously from its own anchor day up to the current bar, giving traders a set of rolling reference levels for recent multi-day price/volume balance.
I built this for my own trading because I couldn't find an existing community script that did exactly this — a set of independent, multi-day rolling VWAP lines in one indicator — so I'm sharing it in case it's useful to others too.
KEY FEATURES
- 5 independently configurable rolling VWAP lines — toggle visibility, set the lookback in calendar days, and pick a color for each line individually.
- Lookback days are entered as calendar days (weekends included), so "6 days back" always lands on the same relative session regardless of where in the week you are.
- Real-price calculation — prices are pulled via request.security() against the plain ticker, so the VWAP values are identical whether your chart is displaying candlesticks, Heikin Ashi, Renko, or any other non-standard chart type. Volume is unaffected by chart type and is used as-is.
- Robust new-day detection — instead of relying on the chart's own bar-by-bar progress to detect a new trading day (which can be unreliable right after the chart first loads), this script requests daily-resolution data directly. Daily data loads much faster than intraday data, so the VWAP anchors are detected reliably even immediately after opening the chart.
HOW TO USE
Open the indicator settings and, for each of the 5 lines, set how many calendar days back you want that VWAP to start accumulating from. Use the lines as dynamic support/resistance or fair-value reference levels, similar to how a session VWAP is used, but for multi-day accumulation periods.
NOTES
- This script requires volume data from your data provider. If no volume is available for the symbol, the VWAP values will not calculate correctly.
- "Rolling Days" counts calendar days, not trading/session days.
Feedback and suggestions are welcome. インジケーター

Rolling Anchored VWAPRolling Anchored VWAP (RAVWAP) plots up to three independent, volume-weighted average price lines that roll forward bar by bar. Unlike session VWAP, which resets at the open, each line uses a moving anchor: at every bar, the window starts exactly N bars ago and runs through the current bar, so you get a continuously updating fair-value reference without session breaks.
Overview
VWAP is widely used by institutions to gauge whether price is trading above or below the volume-weighted average. This indicator extends that idea with rolling anchored windows of any length you choose — useful on any timeframe, including higher timeframes where session VWAP is less relevant.
Each VWAP is fully configurable: enable or disable it, set its own period, color, and line width, and optionally display volume-weighted standard deviation bands at ±1σ, ±2σ, and ±3σ.
How it works
For a given Period setting of N:
The anchor is placed N bars before the current bar
VWAP is calculated from that anchor through the current bar (inclusive)
On each new bar, the anchor advances by one bar
Example with Period = 100:
Bar 100 → VWAP over bars 0 through 100
Bar 101 → VWAP over bars 1 through 101
Bar 102 → VWAP over bars 2 through 102
The calculation uses efficient rolling sums, so it stays responsive even with periods in the hundreds or thousands.
Standard deviation bands use the same volume-weighted formula as TradingView’s built-in VWAP:
σ = √( Σ(V × P²) / Σ(V) − VWAP² )
Band toggles affect display only — they do not change the VWAP value.
Features
3 independent rolling VWAPs with separate periods (defaults: 100, 250, 500)
Individual enable/disable for each VWAP
Custom color and line width per VWAP
Optional ±1σ, ±2σ, ±3σ bands per VWAP
Optional filled band between ±1σ
Configurable source (default: HLC3)
Non-repainting — historical values are fixed after each bar closes
No session resets — continuous rolling windows on any timeframe
Overlay on price — plots directly on the chart scale インジケーター
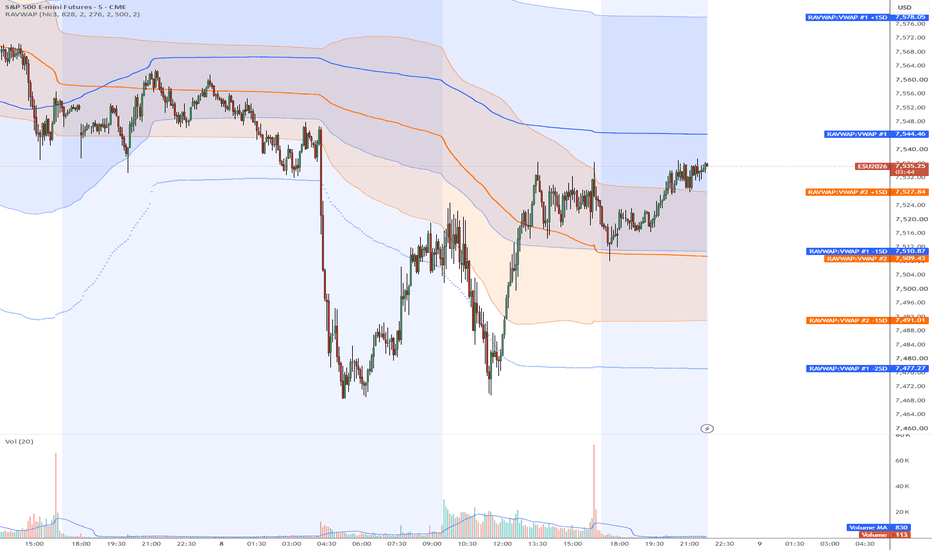
RTH Session VWAPRTH Session VWAP
Timezone-correct session VWAPs (NY RTH, London, Asia) + a 24h VWAP with StdDev bands. Sessions anchor to their own market timezone, so they plot right from anywhere.
Session VWAPs for New York, London, and Asia, plus a continuous 24-hour/daily VWAP, with optional standard-deviation bands — built for intraday futures trading from any timezone.
The core problem this solves: most session-VWAP scripts read their session times in the chart's exchange timezone, so the boundaries drift or break when you view the chart from a different timezone. Here each session is computed in its own explicit market timezone (America/New_York, Europe/London, Asia/Tokyo), so the sessions anchor correctly no matter where you are or how your chart timezone is set. Daylight saving is handled automatically.
Features
New York VWAP defaults to the regular cash session (09:30–16:00 ET), anchored to the RTH open.
London and Asia session VWAPs, each in its own timezone, off by default.
An always-on 24h VWAP anchored to the trading day, drawn independently of the sessions.
Optional ±1 / ±2 standard-deviation bands for every VWAP.
Independent show toggles per session, plus a master switch.
Configurable session hours, timezones, StdDev multipliers, and VWAP source.
Clean chart legend — input arguments and helper plots are kept out of the status line.
How to use
Add to chart. By default you'll see the New York RTH VWAP (green) and the 24h VWAP (amber). Enable the London/Asia sessions or the StdDev bands under Inputs. Session hours are entered in each session's own market timezone (e.g. NY 0930-1600). VWAP and its deviation bands act as intraday mean/value references — price returning to VWAP, or rejecting a ±1/±2 band, are common contexts traders watch.
Credit
This is an open-source modification of "Koalafied VWAP Session/Day" (Session VWAP) by TJ_667, published under the Mozilla Public License 2.0. All original credit goes to TJ_667. This version adds explicit per-session timezones, an RTH default, a 24h VWAP, per-session toggles, and a Pine v6 migration.
Source and notes: github.com インジケーター

インジケーター

Auction & Liquidity Command Center Volume Profile, MeasuredAuction & Liquidity Command Center — Volume Profile, Measured
The levels traders already use — prior POC, value area, naked POCs, prior day high/low, session AVWAP, HVN/LVN — each scored by its measured reaction on this chart: how often price rejects vs breaks, and what the fade has been worth in R. Levels with evidence, not levels with vibes. Never a buy or sell.
What it does
Every structure tool draws levels. None of them measures what happens when price gets there. This tool builds the session-anchored auction map with profile-grade accuracy, detects qualified touches of every level, resolves each touch through a triple-barrier outcome, and pools the results by level TYPE into a live scoreboard: pPOC +0.01R · rej 50% · n156. You see not just where the levels are, but which kinds of levels have actually meant something on this chart — and which are coin flips.
The components, and why they are combined
This is a deliberate synthesis of four parts, each covering the previous one's weakness:
A profile-grade level engine (Market Profile — J. P. Steidlmayer). Nine level types from the session volume-at-price profile and session extremes: prior POC, prior VAH/VAL (classical two-row 70% expansion), naked POCs (prior POCs never revisited), prior day high/low, the session's anchored VWAP, and HVN/LVN volume nodes (prominence-filtered local extremes). Accuracy choices: each bar's volume is distributed range-proportionally across the rows it overlaps (not binned at one point); POC ties break toward the session center. Weakness left open: a drawn level says nothing about whether it matters.
A qualified-touch detector. A level must be ARMED — price fully away from it by at least k×ATR — before a touch of it can count, and it disarms after every touch. Chop sitting on a line cannot enter the record. Approach direction is stored with every event. Weakness left open: a touch is not an outcome.
Triple-barrier outcome resolution (outcome labelling — M. López de Prado). From each touch: REJECT if price moves m×ATR back the way it came first, BREAK if it moves m×ATR through first, TIMEOUT after T bars. Purity rules: barriers are fixed at the ATR of the touch moment; evaluation starts the bar after the touch; a bar hitting both barriers is a timeout, never a guess. Weakness left open: one level's history is n = 1.
Per-TYPE pooling with honesty gates. Statistics pool by level type, never by individual line — a type is a real sample. A type shows no score until a minimum number of its touches have resolved (default 20); until then it reads BUILDING with its count. Timeouts are reported in n but excluded from the reject/break ratio. Fade expectancy = (rejects − breaks) / (rejects + breaks), in R.
How to read it
Rails are colored and styled by type (solid profile levels, dashed day levels, dotted volume nodes, violet naked POCs); each label carries its type's live score or its BUILDING count.
Evidence on the chart: a gray • at every qualified touch, then ○ (teal) where the touch rejected and ✕ (amber) where it broke. Every number on the scoreboard can be audited against the chart.
Dashboard: nearest level and its score, with a plain-language verdict (tends to hold / coin flip / tends to break) so the read needs no statistics background; per-type scoreboard (fade R · reject % · n) for all nine types; touch counts; the exact engine settings in the NOTE row.
Honest expectations: most types on most charts score near zero — that is the truthful baseline, and seeing it protects you from folklore. The value is in the exceptions this chart's own history reveals (for example, day extremes often carry a modest positive fade expectancy while POC retests are a coin flip), and in knowing the difference.
How to use it
Use the scoreboard to weight your own playbook: give more respect to touches of types that have measured well here, less to types that grade as noise — and size accordingly. The "Touch of a MEASURED level" alert fires only when price reaches a type with a real sample behind it. This is context about where price reactions have had structure — never a direction, never an entry signal.
Non-repaint & universality
Profiles, POC/VA/nodes and day levels commit only at session close on confirmed bars; touches and outcomes resolve on confirmed bars; the AVWAP is cumulative within its session. Nothing repaints. The script requests no external data of any kind — no lower timeframes, no security calls — so it runs identically on every plan and every symbol with volume.
Use on any market
Volume source, profile rows, value-area %, node thresholds, arm distance, barriers and sample gates are all inputs. Defaults suit liquid intraday index futures; intraday timeframes give the engine the most touches to learn from.
Originality & credits
The synthesis — a range-proportional session profile, qualified-touch detection, touch-time-ATR triple-barrier outcomes, and per-type pooled reaction statistics displayed as a live scoreboard — is original work for this publication. Concept credits: Market Profile / point of control / value area — J. Peter Steidlmayer; naked (virgin) POC — market-profile literature; anchored VWAP — as popularised in modern trading literature; triple-barrier outcome labelling — M. López de Prado. Implementation and charting design are the author's own.
Disclaimer
Research and education only. NOT financial advice, NOT a signal service, NOT a guarantee of future results. Reaction statistics are empirical frequencies from this chart's limited history, pooled per level type; they change with regime and sample, and a positive expectancy is not a promise. Validate independently and manage your own risk. インジケーター

インジケーター

SMB Fashionably Late Scalp (9EMA x VWAP)SMB "Fashionably Late Scalp" (9 EMA × VWAP) — backtest & study tool
WHAT THIS IS
An open, fully tunable Pine v5 strategy implementation of the "Fashionably Late
Scalp," a 9-EMA-crosses-VWAP intraday setup published by SMB Capital. It is built
for honest backtesting and study of the setup's mechanics — not as a turnkey
profitable system (see "Honest notes on performance" below).
THE SETUP (long; short is the mirror)
1. Divergence — a sustained move separates the 9 EMA from the session VWAP.
2. The Turn — price puts in a distinct low of the day, then starts back up.
3. Convergence — the 9 EMA rises back and crosses VWAP. That cross is the trigger.
Entry: an up-sloping 9 EMA crossing a flat-to-downsloping VWAP (mirror for shorts).
Stop: 1/3 of the distance from VWAP to the low of day.
Target: a measured move — low-of-day to the cross, projected the same distance
beyond the cross.
TWO ENTRY MODES
• Anticipate cross (stop order) : TradingView can normally only act on the
bar AFTER a cross. Because the EMA's next value is deterministic in price
(EMA_next = α·P + (1−α)·EMA_now), the script solves for the exact price P that
makes the 9 EMA meet VWAP and rests a stop order there — so it fills AT the cross,
intrabar. Non-repainting: the trigger is fixed on the closed bar and refreshed
each bar.
• React next bar open (market): conventional market entry on the confirmed cross
(fills one candle late). Kept for A/B comparison.
Note: the anticipatory trigger sits above VWAP by ~4× the EMA-to-VWAP gap (9-EMA
algebra), so the further the EMA lags VWAP at entry, the higher the fill and the
lower the realized reward:risk. A "Minimum reward:risk" input — measured from the
actual fill, not from VWAP — bounds this.
KEY INPUTS
• EMA length; separate EMA & VWAP slope lookbacks/thresholds (VWAP uses a longer
lookback so "flat-to-downsloping" reflects the day's posture, not a 1-bar wiggle)
• Stop fraction, stop-anchor mode, cross-price mode, minimum reward:risk
• "The turn" requirement, re-entry cooldown, long/short toggles
• Optional filters: ideal EST session windows (10:00–10:45 / 10:46–13:30), a
>15-minute EMA-flat veto, and a volume-confirmation filter
• A signal-funnel table (top-right) showing how many crosses survive each gate, so
you can see exactly what is or isn't triggering
REQUIREMENTS & BEHAVIOR
• Needs a volume-bearing instrument (stocks/futures). On symbols without real
volume the session VWAP is undefined and the script stops with a message.
• Session VWAP and the low/high of day share one daily anchor, so they reset
together across RTH/ETH/24h charts.
• Signals evaluate on closed bars; no lookahead. Set realistic commission and
slippage in the Strategy Properties before drawing any conclusions.
HONEST NOTES ON PERFORMANCE
The source cites roughly a 60% win rate at ~3:1 reward:risk. Those numbers come
from a discretionary playbook, and in my own testing this mechanical version does
NOT reproduce them — it is not reliably profitable out of the box. That is
expected: the original depends on trader judgment this code cannot encode
(selecting "in-play" names, reading the speed/quality of the turn, position sizing,
skipping messy tape), and scalping costs erode a thin edge quickly. Treat this as a
faithful study/backtest harness for the mechanics and a base to experiment on — not
a signal to trade live. Nothing here is financial advice; test and manage your own
risk.
CREDITS
Setup concept: SMB Capital ("The Fashionably Late Scalp," public cheat sheet).
Pine v5 implementation, the anticipatory-cross entry, and the diagnostics are mine. ストラテジー

All Session Levels (Futures) - Asia, London, Overnight, NY PriorA session-levels built for trading during the New York session on the Micro Dow (MYM), though it works on any index future or intraday symbol. The core idea: the Asia and London sessions are thin and choppy on the Dow because the underlying US cash market is closed; rather than trading those sessions directly, this indicator plots the key levels they leave behind and helps you trade them when real volume arrives at the 9:30 ET open.
What it plots
Asia session high/low (default 8:00 PM–2:00 AM ET) — overnight liquidity pools.
London session high/low (default 3:00 AM–8:00 AM ET) — the more recent, more relevant overnight range.
Overnight high/low (ONH/ONL) — the full overnight range.
Prior day NY high/low/close — the most-watched daily references, drawn per-day so they don't stretch across chart history.
9:30 NY open marker and a shaded 9:30–10:30 killzone highlighting the highest-probability window.
Auto-detected supply and demand zones — the script identifies base-then-impulse departures (a tight consolidation candle followed by a strong directional move) and draws the base as a zone. Zones remain on the chart only until mitigated: once price closes fully back through a zone, it's automatically removed, so you only ever see live, untested zones.
Info dashboard (top-right) listing every current level and its price.
Alerts
Eight built-in alert conditions: level breaks (London, Asia, and overnight highs/lows) and zone taps (when price enters the most recent unmitigated demand or supply zone). Create them via the alarm-clock icon after adding the indicator; "Once Per Bar Close" is recommended for the break alerts.
How to use it
Set your chart timezone to America/New York (or adjust the timezone input to match your data feed).
Run it on an intraday timeframe, 3m to 15m is the sweet spot; 5m is a good all-round default.
Before the open, review the plotted overnight and prior-day levels.
In the 9:30–10:30 window, watch for price interacting with those levels: a clean break-and-hold for continuation, or a failed break that snaps back inside the range for a reversal.
Use the confluence of a zone tap, price extended past VWAP, and volume for entry confirmation.
Notes and settings
All session windows are fully adjustable in the settings, as are colors, and the supply/demand sensitivity (impulse strength, base size, lookback, and max zones per side).
The overnight window contains the Asia and London windows by design, so ONH/ONL will often overlap those extremes — toggle it off if you prefer less overlap.
The zone-tap alerts track only the most recent unmitigated zone on each side to avoid alert spam.
Disclaimer
This is an analysis and charting tool, not a trading system or financial advice. It does not generate buy/sell signals or guarantee any outcome. Levels and zones are calculated from historical price and session times; past behavior does not predict future results. Always do your own analysis and manage your own risk. インジケーター