Efficiency Ratio Adaptive Moving Average (ERAMA)Efficiency Ratio Adaptive Moving Average (ERAMA)
Efficiency Ratio Adaptive Moving Average (ERAMA) is a smooth adaptive moving average that uses Kaufman's Efficiency Ratio to shift between fast and slow EMA behavior. It then applies WMA and EMA smoothing followed by length-adjusted lag reduction.
The objective is to combine three useful properties in one line: adapt to the directional efficiency of recent price movement, maintain a visually stable baseline, and recover part of the delay introduced by smoothing. ERAMA adjusts the balance between smoothness and responsiveness using current and historical data.
How ERAMA Is Calculated
1. Efficiency Ratio
ERAMA first measures how efficiently the selected Source has moved over the ER Length:
Change = |Source − Source from ER Length bars ago|
Volatility = Sum of |Source − Previous Source| over the ER Length
ER = Change ÷ Volatility
The Efficiency Ratio is bounded between 0 and 1:
• ER near 1 — most movement contributed to net progress in one direction
• ER near 0 — price traveled back and forth with little net progress
Because both Change and Volatility scale with price movement, ER is independent of the instrument's nominal price level.
2. Efficiency-Adaptive EMA Blend
The Fast and Slow lengths create two conventional EMAs of the selected Source:
Fast EMA = EMA(Source, Fast Length)
Slow EMA = EMA(Source, Slow Length)
ERAMA blends these two lines using the current Efficiency Ratio:
Adaptive = Slow EMA + ER × (Fast EMA − Slow EMA)
When ER is high, Adaptive moves closer to the Fast EMA. When ER is low, it stays closer to the Slow EMA. Intermediate ER values produce a proportional blend between the two.
This construction uses Kaufman's Efficiency Ratio as an adaptive weight, but it is not the standard recursive Kaufman Adaptive Moving Average (KAMA) formula.
3. WMA and EMA Smoothing
The adaptive blend passes through two smoothing stages:
WMA Base = WMA(Adaptive, WMA Smooth Length)
Smoothed = EMA(WMA Base, EMA Smooth Length)
The WMA gives greater weight to recent observations. The following EMA softens residual variation and determines the main output horizon. Higher values create a steadier line but also introduce more delay.
4. Length-Adjusted Lag Reduction
ERAMA compares the Smoothed line with an EMA-smoothed version of itself:
Responsiveness Scale = Min(1, 50 ÷ EMA Length)^Responsiveness Length Decay
Effective Responsiveness = Responsiveness × Responsiveness Scale
ERAMA = Smoothed + Effective Responsiveness ×
The difference between Smoothed and EMA(Smoothed) acts as a DEMA-style lag correction. A Responsiveness value of 0 disables this correction. A value of 1 applies the full correction before length scaling.
For EMA lengths of 50 or less, Responsiveness Scale equals 1. Above 50, the scale decreases gradually according to Responsiveness Length Decay. This keeps one Responsiveness setting practical across short and long EMA lengths. A decay value of 0 disables length-based scaling.
The Mathematical Idea
ERAMA separates adaptation, smoothing, and lag reduction into distinct stages.
The Efficiency Ratio controls the position between two already-defined EMA responses. WMA and EMA then create a stable output baseline. Finally, a partial DEMA-style correction restores part of the response lost to smoothing. The correction is reduced progressively for longer EMA lengths, where the distance between a line and its second EMA can otherwise become disproportionately large.
This is a causal construction: every stage uses only current and past data. The lag-reduction term can increase turning sensitivity and may create overshoot at aggressive settings, but the Responsiveness and Responsiveness Length Decay controls make that tradeoff explicit.
Characteristics and Advantages
• Efficiency-based adaptation using a bounded 0-to-1 ratio
• Interpretable Fast and Slow EMA anchors
• WMA and EMA smoothing for a stable visual baseline
• Adjustable partial-DEMA lag reduction
• Automatic responsiveness scaling for longer EMA lengths
How to Read ERAMA
Read ERAMA through its slope, its position relative to price, and the behavior of price around the line.
Slope
A rising ERAMA indicates that the smoothed adaptive baseline is moving higher. A falling ERAMA indicates that it is moving lower. A flattening line suggests weaker directional progress or a transition between trend phases.
Price Position
Price holding above a rising ERAMA supports a bullish directional interpretation. Price holding below a falling ERAMA supports a bearish interpretation. Repeated crossings often occur when price is rotating around the adaptive baseline or directional control is weak.
Distance and Reversals
A widening distance between price and ERAMA can reflect strong momentum or extension from the baseline. The lag-reduction stage helps ERAMA respond sooner when the smoothed path turns.
Understanding the Settings
Source
Selects the price series used by ERAMA. The default is HLCC4: the average of High, Low, Close, and Close.
ER Length
Controls the period used to measure directional efficiency. Lower values react to recent path changes sooner. Higher values evaluate efficiency over a broader window.
Fast Length
Sets the Fast EMA used by the adaptive blend. Lower values make the high-efficiency response faster. Fast Length must be lower than Slow Length.
Slow Length
Sets the Slow EMA used by the adaptive blend. Higher values make the low-efficiency response more conservative. Slow Length must be higher than Fast Length.
Responsiveness
Controls the strength of the lag-reduction term. A value of 0 uses the fully smoothed line. Higher values reduce more lag but can increase turning sensitivity and overshoot.
Responsiveness Length Decay
Controls how strongly Responsiveness decreases for EMA lengths above 50. Higher values apply more reduction to long-period lines. A value of 0 uses the same Responsiveness at every EMA length.
WMA Smooth Length
Controls the first smoothing stage. Higher values produce a steadier line with more delay.
EMA Smooth Length
Controls the primary output horizon and the period used by the lag-reduction EMA. Higher values create a smoother, slower baseline.
Default Configuration
Source: HLCC4
ER Length: 10
Fast Length: 2
Slow Length: 30
Responsiveness: 0.88
Responsiveness Length Decay: 0.15
WMA Smooth Length: 12
EMA Smooth Length: 20
Practical Use
ERAMA can serve as an adaptive trend baseline, directional filter, pullback reference, or trade-management guide. It is intended for traders who prefer to interpret slope and price structure directly.
Responsiveness can be tuned to emphasize steadier trend tracking or earlier reactions to short-term changes. The settings can be adapted to the instrument, timeframe, and intended holding period.
---
Efficiency Ratio Adaptive Moving Average (ERAMA)
Efficiency Ratio Adaptive Moving Average(效率比率自適應移動平均線)是一條平滑的自適應移動平均線。它利用考夫曼效率比率(Efficiency Ratio),在快速與慢速 EMA 之間調整,再依次套用 WMA、EMA 平滑及按長度調整的延遲縮減。
ERAMA 的目標,是在一條線內結合三項特性:根據近期價格移動的方向效率作出適應、維持視覺穩定的基準,以及追回部分平滑所造成的延遲。ERAMA 使用目前及歷史資料,調整平滑度與反應速度之間的平衡。
ERAMA 如何計算
1. 效率比率
ERAMA 先衡量所選 Source 在 ER Length 期間內的移動效率:
變化 = |目前 Source − ER Length 之前的 Source|
波動 = ER Length 內每根 K 線之 |Source − 前一個 Source| 總和
ER = 變化 ÷ 波動
效率比率保持在 0 至 1 之間:
• ER 接近 1 — 大部分移動形成單一方向的淨進展
• ER 接近 0 — 價格反覆來回,總路徑較長但淨進展有限
由於變化與波動都會隨價格移動幅度同比例改變,因此 ER 不受商品名義價格水平影響。
2. 效率自適應 EMA 混合
Fast 與 Slow 長度會從所選 Source 建立兩條傳統 EMA:
Fast EMA = EMA(Source,Fast Length)
Slow EMA = EMA(Source,Slow Length)
ERAMA 使用目前的效率比率混合兩條線:
Adaptive = Slow EMA + ER ×(Fast EMA − Slow EMA)
ER 偏高時,Adaptive 會靠近 Fast EMA;ER 偏低時,則靠近 Slow EMA。介乎兩者之間的 ER 會按比例混合兩條 EMA。
這個結構使用考夫曼效率比率作為自適應權重,但並不是標準的遞迴考夫曼自適應移動平均線(KAMA)公式。
3. WMA 與 EMA 平滑
自適應混合結果會通過兩層平滑:
WMA Base = WMA(Adaptive,WMA Smooth Length)
Smoothed = EMA(WMA Base,EMA Smooth Length)
WMA 對較近期數值給予更高權重,後續 EMA 則柔化剩餘變化,並決定主要輸出週期。較高數值會令線條更穩定,但亦會增加延遲。
4. 按長度調整的延遲縮減
ERAMA 會比較 Smoothed 與其 EMA 平滑版本:
Responsiveness Scale = Min(1,50 ÷ EMA Length)^Responsiveness Length Decay
Effective Responsiveness = Responsiveness × Responsiveness Scale
ERAMA = Smoothed + Effective Responsiveness ×
Smoothed 與 EMA(Smoothed)之間的差值形成 DEMA 式延遲修正。Responsiveness 設為 0 會停用修正;設為 1 則代表在長度縮放前套用完整修正。
EMA Length 為 50 或以下時,Responsiveness Scale 等於 1。高於 50 後,縮放值會按照 Responsiveness Length Decay 逐步下降,令同一組 Responsiveness 設定可以較合理地跨越短期及長期 EMA 使用。Decay 設為 0 會停用按長度縮放。
數學設計
ERAMA 把自適應、平滑及延遲縮減分成三個獨立階段。
效率比率控制結果在兩條既定 EMA 反應之間的位置;WMA 與 EMA 形成穩定輸出基準;最後的部分 DEMA 式修正,追回一部分因平滑而失去的反應速度。對較長 EMA 而言,線條與其第二層 EMA 之間的差距可能較大,因此修正會隨長度逐步降低。
整個結構只使用目前及過往資料。延遲縮減可提高轉向靈敏度,較進取的設定亦可能產生超調;Responsiveness 與 Responsiveness Length Decay 讓這項取捨可以直接調整。
特性與優點
• 使用 0 至 1 有界效率比率作出適應
• Fast 與 Slow EMA 具有清晰可解釋的反應界線
• WMA 與 EMA 平滑形成穩定視覺基準
• 可調整的部分 DEMA 式延遲縮減
• 長週期 EMA 自動降低反應修正
如何閱讀 ERAMA
閱讀 ERAMA 時,應觀察線條斜率、價格相對位置,以及價格在線條附近的行為。
斜率
ERAMA 上升表示平滑後的自適應基準正在提高;ERAMA 下跌表示基準正在降低。線條逐漸走平,通常代表方向進展減弱,或市場正處於趨勢轉換階段。
價格位置
價格維持在上升 ERAMA 之上,可支持偏多方向判斷;價格維持在下降 ERAMA 之下,可支持偏空判斷。價格反覆穿越 ERAMA,通常出現在價格圍繞自適應基準旋轉,或方向控制偏弱的市況。
距離與轉向
價格與 ERAMA 的距離擴大,可能反映動能增強或價格已偏離基準。延遲縮減讓 ERAMA 在平滑路徑轉向時較早反應。
設定說明
Source
選擇 ERAMA 使用的價格序列。預設為 HLCC4,即 High、Low、Close、Close 的平均值。
ER Length
控制衡量方向效率的期間。較低數值會更快反映近期路徑變化;較高數值則在較廣時間範圍內評估效率。
Fast Length
設定自適應混合使用的 Fast EMA。較低數值會加快高效率市況下的反應。Fast Length 必須低於 Slow Length。
Slow Length
設定自適應混合使用的 Slow EMA。較高數值會令低效率市況下的反應更保守。Slow Length 必須高於 Fast Length。
Responsiveness
控制延遲縮減項的強度。設為 0 時使用完整平滑後的線條;較高數值會追回更多延遲,但亦可能提高轉向靈敏度及超調。
Responsiveness Length Decay
控制 EMA Length 高於 50 後,Responsiveness 隨長度下降的幅度。較高數值會對長週期線條施加更大降幅;設為 0 則所有 EMA Length 使用相同 Responsiveness。
WMA Smooth Length
控制第一層平滑。較高數值會形成更穩定但延遲更多的線條。
EMA Smooth Length
控制主要輸出週期,以及延遲縮減 EMA 所使用的週期。較高數值會形成更平滑、較慢的基準。
預設設定
Source:HLCC4
ER Length:10
Fast Length:2
Slow Length:30
Responsiveness:0.88
Responsiveness Length Decay:0.15
WMA Smooth Length:12
EMA Smooth Length:20
實際應用
ERAMA 可作為自適應趨勢基準、方向過濾器、回調參考或交易管理線,適合希望直接解讀斜率及價格結構的交易者。
Responsiveness 可用來偏向更穩定的趨勢跟隨,或更早反映短期變化。設定可按商品、時間週期及預計持倉時間調整。
---
Efficiency Ratio Adaptive Moving Average (ERAMA)
Efficiency Ratio Adaptive Moving Average(効率比適応型移動平均線)は、カウフマンの効率比(Efficiency Ratio)を利用して速いEMAと遅いEMAの挙動を動的に切り替える、滑らかな適応型移動平均線です。WMA(加重移動平均)とEMA(指数移動平均)による平滑化を行った後、期間長に連動したラグ(遅延)削減処理を適用します。
ERAMAの目的は、3つの有用な特性を1本のラインに統合することです。すなわち、近年の価格値動きの方向性効率に適応すること、視覚的に安定したベースラインを維持すること、そして平滑化によって生じる遅延の一部を取り戻すことです。ERAMAは、現在および過去のデータを用いて平滑性と応答性のバランスを調整します。
ERAMA の計算方法
1. 効率比(Efficiency Ratio)
ERAMAはまず、選択された Source が ER Length 期間内にどれほど効率的に動いたかを測定します。
変化量 = |現在の Source − ER Length 本前の Source|
変動量 = ER Length 期間内の各バーにおける |Source − 前回の Source| の総和
効率比(ER)= 変化量 ÷ 変動量
効率比(ER)は 0 から 1 の範囲に収まります。
• ERが 1 に近い — 値動きの大半が一定方向への純粋な推進に寄与している
• ERが 0 に近い — 価格が反覆移動を繰り返し、総移動距離に対して純推進がほとんどない
変化量と変動量の双方が価格の移動規模に応じてスケールするため、ERは銘柄固有の価格水準(呼び値)に依存しません。
2. 効率適応型 EMA ブレンド
Fast Length と Slow Length のパラメータにより、選択した Source から2つの従来の EMA を作成します。
Fast EMA = EMA(Source, Fast Length)
Slow EMA = EMA(Source, Slow Length)
ERAMAは、現在の効率比(ER)を用いてこれら2つのラインをブレンドします。
Adaptive = Slow EMA + ER ×(Fast EMA − Slow EMA)
ERが高いとき、Adaptiveは Fast EMA に近づきます。ERが低いとき、Slow EMA の近くにとどまります。中間のER値では、2つのEMA間で比例的なブレンドが行われます。
この構造はカウフマンの効率比を適応型ウェイトとして使用していますが、標準的な再帰型カウフマン自適応移動平均線(KAMA)の計算式とは異なります。
3. WMA および EMA による平滑化
自適応ブレンド(Adaptive)は、2段階の平滑化処理を通過します。
WMA Base = WMA(Adaptive, WMA Smooth Length)
Smoothed = EMA(WMA Base, EMA Smooth Length)
WMAは直近のデータに高い重みを置きます。続くEMAは残留変動をなめらかにし、主要な出力周期(時間軸)を決定します。数値を高く設定するほどラインは安定しますが、遅延も大きくなります。
4. 期間長に応じたラグ(遅延)削減
ERAMAは、Smoothed ラインと、それをさらにEMA平滑化したラインを比較します。
Responsiveness Scale = Min(1, 50 ÷ EMA Length)^Responsiveness Length Decay
Effective Responsiveness = Responsiveness × Responsiveness Scale
ERAMA = Smoothed + Effective Responsiveness ×
Smoothed と EMA(Smoothed)の差分は、DEMA(二重指数移動平均)スタイルのラグ補正として機能します。Responsiveness を 0 に設定するとこの補正は無効になり、1 に設定すると期間長のスケーリングが適用される前の完全な補正が行われます。
EMA Length が 50 以下のケースでは、Responsiveness Scale は 1 となります。50 を超えると、Responsiveness Length Decay に従ってスケーリング値が徐々に低下します。これにより、短期から長期のEMA期間まで同一の Responsiveness 設定を合理的に運用できます。Decay を 0 に設定すると、期間長に基づくスケーリングが無効になります。
数学的概念と設計思想
ERAMAは「適応」「平滑化」「ラグ削減」を独立した段階として明確に分離しています。
効率比(ER)が、あらかじめ定義された2つのEMA応答の間の位置を制御します。次にWMAとEMAが安定した出力ベースラインを形成します。最後に、部分的なDEMAスタイル補正によって、平滑化で失われた応答速度の一部を取り戻します。長期間のEMAでは、ラインとその2次EMAの間の乖離が過大になる可能性があるため、補正量は長さに応じて段階的に削減されます。
これは完全な因果的構造であり、すべての段階で現在および過去のデータのみを使用します。ラグ削減機能は転換の感度を高める一方で、アグレッシブな設定ではオーバーシュートを引き起こす可能性がありますが、Responsiveness と Responsiveness Length Decay のコントロールにより、このトレードオフを明示的に調整できます。
特徴とメリット
• 0〜1 の有界な効率比に基づく自適応性
• 明確に解釈可能な Fast および Slow EMA アンカー
• 安定した視覚的ベースラインを形成する WMA および EMA 平滑化
• 調整可能な部分 DEMA スタイル・ラグ削減
• 長期 EMA 期間におけるレスポンス補正の自動スケーリング
ERAMA の読み方・分析方法
ERAMAを読み解く際は、ラインの傾き、価格の相対位置、そしてライン周辺での価格の挙動に着目します。
傾き(スロープ)
ERAMAの上昇は、平滑化された自適応ベースラインが切り上がっていることを示します。ERAMAの下降は、ベースラインが切り下がっていることを示します。ラインの平坦化は、方向性の勢いの減衰、またはトレンドの移行期を示唆します。
価格の位置関係
価格が上昇するERAMAの上方で推移している場合は強気(ブル)の方向性を支持し、下降するERAMAの下方で推移している場合は弱気(ベア)の方向性を支持します。ERAMAとの頻繁な交差(クロスオーバー)は、価格がベースライン付近で保ち合いを形成しているか、方向性の主導権が弱い状態によく見られます。
乖離と反転
価格とERAMAとの距離が拡大している場合は、強力なモメンタムまたはベースラインからの乖離を反映しています。ラグ削減ステージにより、平滑化された軌跡が反転する際、ERAMAはより早期に反応することができます。
設定パラメータの理解
Source
ERAMAで使用する価格シリーズを選択します。デフォルトは HLCC4(High, Low, Close, Close の平均値)です。
ER Length
方向性の効率(Efficiency Ratio)を測定する期間を制御します。値が小さいほど直近の値動きの変化に素早く反応し、値が大きいほど広い期間で効率性を評価します。
Fast Length
適応ブレンドで使用する Fast EMA を設定します。値が小さいほど、高効率相場での反応が速くなります。Fast Length は Slow Length より小さく設定する必要があります。
Slow Length
適応ブレンドで使用する Slow EMA を設定します。値が大きいほど、低効率相場での反応が控えめになります。Slow Length は Fast Length より大きく設定する必要があります。
Responsiveness
ラグ削減項の強度を制御します。0 に設定すると完全に平滑化されたラインを使用します。高い値を設定するほどラグが解消されますが、転換時の感度やオーバーシュートが増加する場合があります。
Responsiveness Length Decay
EMA Length が 50 を超えた際に、Responsiveness が減衰する度合いを制御します。高い値を設定するほど長期ラインへの減衰が強く適用されます。0 に設定すると、すべての EMA Length で同じ Responsiveness が適用されます。
WMA Smooth Length
第1段階の平滑化期間を制御します。値が大きいほど、より遅延のある安定したラインを生成します。
EMA Smooth Length
主要な出力周期およびラグ削減用 EMA の期間を制御します。値が大きいほど、より平滑で緩やかなベースラインを生成します。
デフォルト設定
Source: HLCC4
ER Length: 10
Fast Length: 2
Slow Length: 30
Responsiveness: 0.88
Responsiveness Length Decay: 0.15
WMA Smooth Length: 12
EMA Smooth Length: 20
実戦での活用方法
ERAMAは、自適応型のトレンドベースライン、方向性フィルター、押し目・戻りの参照線、あるいはトレード管理ガイドとして活用できます。ラインの傾きや価格構造を直接解釈することを好むトレーダーに適しています。
Responsiveness をチューニングすることで、安定したトレンド追従を重視するか、短期的な変化への早期反応を重視するかを調整できます。設定は取引銘柄、時間軸、および想定する保有期間に応じて最適化することが可能です。
インジケーター

Vector Coherence Moving Average (VCMA)Vector Coherence Moving Average (VCMA)
Vector Coherence Moving Average (VCMA) is an adaptive moving average based on the directional alignment of recent price-change vectors. It is intentionally presented as a thin, fixed-color line.
VCMA adjusts its smoothing speed according to two questions: Are recent price changes pointing in a consistent direction? Is that consistency supported by several meaningful moves rather than one isolated event? Strong, well-supported alignment makes the average more responsive. Weak or poorly supported alignment keeps it closer to its slow response.
How VCMA Is Calculated
1. Delay-Coordinate Price Path
VCMA first calculates the bar-to-bar change in the selected Source:
d(t) = Source(t) - Source(t-1)
It then represents price as a point on a two-dimensional delay-coordinate path:
X(t) =
Moving from X(t-1) to X(t) creates the lag vector:
z(t) = X(t) - X(t-1) =
Magnitude(t) = sqrt
During persistent movement, these vectors tend to point in similar directions. During back-and-forth movement, they point in conflicting directions and cancel when summed.
2. Vector Coherence
Over the selected Coherence Length, VCMA compares the straight-line displacement of this path with the total distance it traveled. Equivalently, it compares the length of the summed vector with the sum of all individual vector lengths:
rho = sqrt / Sum sqrt
In this form, rho is a two-dimensional path-efficiency, or straightness, ratio.
The triangle inequality keeps rho between 0 and 1:
• rho near 1 - recent lag vectors are strongly aligned
• rho near 0 - vector directions largely cancel
Both parts of the ratio scale with price movement, so vector coherence is independent of the instrument's nominal price level.
3. Effective-Move Support
A single large move can produce high coherence simply because little else opposes it. VCMA therefore calculates an effective sample size from vector magnitudes:
Effective Moves = (Sum Magnitude)^2 / Sum Magnitude^2
This is a participation measure rather than a literal count of bars. It is low when one move dominates and rises when several moves contribute meaningful magnitude.
Support = Clamp
With the default target of 3, VCMA requires broader support before using the full coherence signal. This reduces immediate maximum-speed reactions to an isolated gap, spike, or wick.
4. Adaptive Alpha
The Fast and Slow periods define the response limits of the recursive average. The script automatically treats the shorter input as Fast and the longer input as Slow:
Fast Alpha = 2 / (Fast Period + 1)
Slow Alpha = 2 / (Slow Period + 1)
Speed Gate = rho^Coherence Power x Support
Adaptive Alpha = Slow Alpha + (Fast Alpha - Slow Alpha) x Speed Gate
Raw VCMA = Previous Raw VCMA + Adaptive Alpha x (Source - Previous Raw VCMA)
Alpha always remains between the selected Slow and Fast values. Coherence Power shapes the transition: higher values require rho to move closer to 1 before VCMA accelerates substantially.
5. Output WMA
The displayed line is a weighted moving average of the raw adaptive result:
VCMA = WMA(Raw VCMA, Output WMA Length)
The default 3-period WMA reduces small residual turns while adding only modest lag. Set the length to 1 to display the unsmoothed adaptive core.
The Mathematical Idea
VCMA introduces a distinctive adaptive-moving-average construction that extends one-dimensional price-path efficiency into a two-dimensional delay-coordinate path and adds an effective-move gate to reduce acceleration caused by isolated shocks.
The delayed price points X(t) = form a path whose steps are the vectors . The coherence ratio is the path's net displacement divided by its total traveled distance. It therefore measures how straight and directionally consistent the recent delayed path has been. Unlike a one-dimensional ratio, it can also respond to irregular relationships between adjacent price changes, even when those changes share the same sign.
The effective-move gate adds an additional test for concentration. Vector coherence measures directional agreement; effective-move support measures whether that agreement is distributed across enough movement. VCMA accelerates only when both conditions support the change.
This gives VCMA a causal, scale-free, and bounded adaptive core. It does not project price forward, and the final WMA uses only positive weights. Like every moving average, VCMA still has lag. Its purpose is to vary that lag according to the observed structure of the price path.
Characteristics and Advantages
• Clean fixed-color presentation with no embedded trend classification
• Scale-free vector-coherence measurement
• Bounded response between interpretable Fast and Slow periods
• Reduced sensitivity to isolated high-coherence shocks
• Adjustable nonlinear response through Coherence Power
• Optional short WMA for a steadier final line
• Internal diagnostics available in TradingView's Data Window
How to Read VCMA
VCMA uses one fixed color; color carries no directional or regime meaning. Read the line through its slope, its position relative to price, and the way price behaves around it.
Slope
A rising VCMA indicates that the adaptive baseline is moving higher. A falling VCMA indicates that it is moving lower. A flattening line suggests that recent directional progress is weakening or becoming less consistent.
Price Position
Price holding above a rising VCMA supports a bullish trend interpretation. Price holding below a falling VCMA supports a bearish interpretation. The combination of price position and slope is more informative than either observation alone.
Distance and Crossings
A widening distance between price and VCMA can reflect strong momentum, but it may also indicate extension from the adaptive baseline. Pullbacks toward VCMA can provide trend context when market structure remains intact. Repeated crossings usually indicate unsettled or range-bound movement where a moving-average baseline has less value.
Data Window Diagnostics
• VCMA Coherence Score - raw vector coherence multiplied by move support
• VCMA Raw Vector Coherence - directional alignment before the support gate
• VCMA Effective-Move Support - how broadly vector magnitude is distributed
• VCMA Adaptive Alpha - the smoothing coefficient used by the raw core
High raw coherence with low support often means that one dominant event has not yet received enough support from other moves. High coherence and high support allow alpha to move toward its Fast limit.
Understanding the Settings
Source
Selects the price series used by VCMA. The default is Close.
Coherence Length
Controls the window used to measure vector alignment. Shorter values adapt sooner; longer values evaluate a broader path and usually change more gradually.
Fast Period and Slow Period
Define the fastest and slowest possible responses. A shorter Fast Period increases maximum responsiveness. A longer Slow Period makes VCMA more conservative when coherence or support is weak.
Coherence Power
Higher values suppress medium coherence more strongly and reserve fast responses for readings closer to 1. Lower values produce a softer, earlier acceleration.
Effective Moves for Full Speed
Sets how much distributed movement is required for full support. Higher values reject isolated movement more strongly but may delay acceleration at the beginning of a genuine trend.
Output WMA Length
Controls final smoothing. Higher values produce a steadier line with more lag. A value of 1 disables this stage.
Practical Use
VCMA can serve as an adaptive trend baseline, a pullback reference, a directional filter, or a mathematical building block beside other indicators. Its minimal presentation is useful when the trader wants to interpret the average directly rather than rely on built-in state colors or crossover logic.
VCMA does not predict future price or eliminate whipsaws. Settings should be matched to the instrument, timeframe, and intended holding period, with price structure, volatility, volume, and higher-timeframe context used as additional evidence.
---
Vector Coherence Moving Average (VCMA)
Vector Coherence Moving Average (向量一致性移動平均線) 是以近期價格變化向量之方向一致性為基礎的自適應移動平均線。它刻意保持簡潔,使用固定顏色的細線。
VCMA 會根據兩個問題調整平滑速度:近期價格變化是否朝向一致方向?這種一致性是否得到多個具實質幅度的移動支持,而不是只來自單一事件?方向一致而且支持充分時,VCMA 會提高反應速度;任何一項偏弱,反應便會靠近 Slow 設定。
VCMA 如何計算
1. 延遲座標價格路徑
VCMA 先計算所選 Source 每根 K 線的價格變化:
d(t) = Source(t) - Source(t-1)
然後把價格表示為二維延遲座標路徑上的一個點:
X(t) =
由 X(t-1) 移動至 X(t) 時,便會形成滯後向量:
z(t) = X(t) - X(t-1) =
Magnitude(t) = sqrt
方向持續時,這些向量通常朝向相近方向;價格來回移動時,向量方向互相矛盾,加總後便會抵消。
2. 向量一致性
在 Coherence Length 所設定的週期內,VCMA 比較這條路徑的直線位移與實際行走總距離。等價地說,就是比較「向量總和的長度」與「所有個別向量長度的總和」:
rho = sqrt / Sum sqrt
以這種形式理解,rho 就是二維路徑效率,亦即路徑直線度的比率。
根據三角不等式,rho 會保持在 0 至 1 之間:
• rho 接近 1 - 近期滯後向量方向高度一致
• rho 接近 0 - 向量方向大部分互相抵消
分子與分母都會隨價格變化幅度按比例改變,因此向量一致性不受商品名義價格水平影響。
3. 有效移動支持度
單一大幅移動也可能產生偏高的一致性,因為沒有其他向量與它抵消。VCMA 因此利用向量幅度計算有效樣本數:
Effective Moves = (Sum Magnitude)^2 / Sum Magnitude^2
這是參與程度的量度,不是 K 線數量的直接計數。當一個移動佔據大部分幅度時,數值偏低;當多個移動都有實質貢獻時,數值便會上升。
Support = Clamp
預設目標為 3,VCMA 需要較廣泛的支持才會完整採用一致性訊號。這可減少單一裂口、急升急跌或影線令平均線立即切換至最高速度的情況。
4. 自適應 Alpha
Fast 與 Slow 週期定義遞迴平均線的反應上下限。程式會自動把較短輸入視為 Fast,較長輸入視為 Slow:
Fast Alpha = 2 / (Fast Period + 1)
Slow Alpha = 2 / (Slow Period + 1)
Speed Gate = rho^Coherence Power x Support
Adaptive Alpha = Slow Alpha + (Fast Alpha - Slow Alpha) x Speed Gate
Raw VCMA = Previous Raw VCMA + Adaptive Alpha x (Source - Previous Raw VCMA)
Alpha 始終保持在所選的 Slow 與 Fast 數值之間。Coherence Power 控制轉換曲線;數值越高,rho 越需要接近 1,VCMA 才會明顯加速。
5. 輸出 WMA
圖表上的線條是原始自適應結果的加權移動平均:
VCMA = WMA(Raw VCMA, Output WMA Length)
預設的 3 週期 WMA 可減少細微轉折,同時只加入有限延遲。設為 1,即可顯示未經額外平滑的自適應核心。
數學設計
VCMA 採用一種具辨識度的自適應移動平均線結構:把一維價格路徑效率延伸為二維延遲座標路徑,並加入有效移動閘門,以降低孤立價格衝擊造成的加速。
延遲價格點 X(t) = 形成一條路徑,而 就是路徑上的每一步。向量一致性比率等於路徑的淨位移除以實際行走總距離,因此可衡量近期延遲路徑有多筆直,以及方向有多一致。與一維比率不同,即使價格變化方向相同,若相鄰變化之間的關係反覆而不規則,這個二維比率仍可作出區分。
有效移動閘門再加入集中度檢查。向量一致性衡量方向是否配合;有效移動支持度則衡量這種配合是否分布於足夠的移動。只有兩項條件同時成立,VCMA 才會加快。
這個自適應核心只使用當前及過往資料,不受價格尺度影響,而且 Alpha 有明確上下限。它不會向前投射價格,最後的 WMA 亦只使用正權重。VCMA 仍然是移動平均線,因此必然存在延遲;它的作用是根據已觀察到的價格路徑結構調整延遲。
特性與優點
• 固定顏色的簡潔顯示,不加入內置趨勢分類
• 不受價格尺度影響的向量一致性量度
• 反應速度受具體 Fast 與 Slow 週期限制
• 降低孤立而高一致性的價格衝擊所造成的影響
• 可用 Coherence Power 調整非線性反應
• 可選用短週期 WMA 整理最終線條
• 在 TradingView Data Window 提供內部診斷數值
如何閱讀 VCMA
VCMA 使用單一固定顏色,顏色不代表方向或市場狀態。閱讀時應觀察線條斜率、價格相對位置,以及價格在 VCMA 附近的行為。
斜率
VCMA 上升,表示自適應基準正在提高;VCMA 下跌,表示基準正在降低。線條逐漸走平,通常代表近期方向進展正在減弱,或價格移動的一致性下降。
價格位置
價格維持在上升 VCMA 之上,可支持多頭趨勢判斷;價格維持在下降 VCMA 之下,可支持空頭判斷。價格位置與線條斜率配合使用,比單獨觀察任何一項更有參考價值。
距離與穿越
價格與 VCMA 的距離擴大,可能反映動能增強,也可能表示價格已偏離自適應基準。當市場結構仍然完整,回調至 VCMA 附近可提供趨勢背景。價格反覆穿越 VCMA,通常表示市況反覆或橫行,此時移動平均線基準的參考價值會下降。
Data Window 診斷數值
• VCMA Coherence Score - 原始向量一致性乘以移動支持度
• VCMA Raw Vector Coherence - 未加入支持閘門前的方向一致性
• VCMA Effective-Move Support - 向量幅度的分布廣度
• VCMA Adaptive Alpha - 原始核心實際使用的平滑係數
Raw Vector Coherence 偏高但 Support 偏低,通常代表一次主導事件尚未得到其他移動充分配合。一致性與支持度同時偏高時,Alpha 才可向 Fast 上限移動。
設定說明
Source
選擇 VCMA 使用的價格序列,預設為 Close。
Coherence Length
控制衡量向量一致性的週期。較短數值適應更快;較長數值會評估更廣的價格路徑,變化通常較慢。
Fast Period 與 Slow Period
定義最快及最慢反應。較短的 Fast Period 會提高最大靈敏度;較長的 Slow Period 則會在一致性或支持度偏弱時令 VCMA 更保守。
Coherence Power
較高數值會更強地壓低中等一致性的作用,只在 rho 接近 1 時採用較快反應。較低數值會較早及較平順地提高速度。
Effective Moves for Full Speed
設定完整支持所需的分布程度。較高數值能更強地抑制孤立移動,但也可能延遲真實趨勢初段的加速。
Output WMA Length
控制最終平滑程度。數值越高,線條越穩定,但延遲亦會增加。設為 1 可停用這一層。
實際應用
VCMA 可作為自適應趨勢基準、回調參考、方向過濾器,亦可配合其他指標作為數學基礎線。它不提供內置狀態顏色或交叉邏輯,適合希望直接判讀平均線本身的交易者。
VCMA 不會預測未來價格,也不能消除所有來回穿越。設定應配合商品、時間週期與預計持倉時間,並以價格結構、波動性、成交量及較高時間週期背景作為補充證據。
---
Vector Coherence Moving Average(VCMA)
Vector Coherence Moving Average(ベクトル・コヒーレンス移動平均線、VCMA)は、直近の価格変化ベクトルがどの程度同じ方向にそろっているかを基準に、反応速度を調整する適応型移動平均線です。チャート上では、細い単色ラインでシンプルに表示されます。
VCMAは、次の2点をもとに平滑化の速度を調整します。直近の価格変化は一貫した方向を向いているか。その一貫性は単発の値動きではなく、複数の意味のある変動によって支えられているか。方向がそろい、かつ十分な裏付けがあるときは反応を速め、どちらかが弱いときはSlow側の穏やかな反応に近づきます。
VCMAの計算方法
1. 遅延座標上の価格経路
VCMAはまず、選択したSourceについて、各バー間の価格変化を計算します。
d(t) = Source(t) - Source(t-1)
次に、価格を2次元の遅延座標上にある点として表します。
X(t) =
X(t-1)からX(t)への移動によって、次の遅延ベクトルが得られます。
z(t) = X(t) - X(t-1) =
Magnitude(t) = sqrt
方向性のある値動きが続くと、これらのベクトルは似た方向を向く傾向があります。一方、価格が往復するとベクトルの方向が食い違い、合計したときに互いを打ち消します。
2. ベクトル・コヒーレンス
設定したCoherence Lengthの範囲で、VCMAはこの経路の直線変位と、実際にたどった総距離を比較します。これは、合成ベクトルの長さと、各ベクトルの長さの合計を比較することと同じです。
rho = sqrt / Sum sqrt
この形で見ると、rhoは2次元の経路効率、つまり経路の直進性を表す比率です。
三角不等式により、rhoは0から1の範囲に収まります。
• rhoが1に近い - 直近の遅延ベクトルが高い精度で同じ方向にそろっている
• rhoが0に近い - ベクトルの方向が互いに大きく打ち消し合っている
分子と分母はどちらも価格変動の大きさに比例するため、ベクトル・コヒーレンスは銘柄の名目価格水準に左右されません。
3. 有効変動の支持度
単発の大きな変動は、それに逆らう動きがほとんどないだけで、高いコヒーレンスを生む場合があります。そこでVCMAは、ベクトルの大きさから有効サンプルサイズを計算します。
Effective Moves = (Sum Magnitude)^2 / Sum Magnitude^2
これはバー数そのものではなく、どれだけ多くの値動きが実質的に寄与しているかを表す指標です。1つの変動が全体を支配していると低くなり、複数の変動が十分な大きさで寄与すると高くなります。
Support = Clamp
初期設定の目標値は3です。VCMAがコヒーレンス信号を完全に反映するには、複数の値動きによる十分な裏付けが必要になります。これにより、単発のギャップ、急騰・急落、長いヒゲに反応して、ただちに最高速度へ切り替わる動きを抑えます。
4. 適応型Alpha
Fast PeriodとSlow Periodは、再帰型平均線の反応速度の上限と下限を定めます。入力順が逆でも、短い方をFast、長い方をSlowとして自動的に扱います。
Fast Alpha = 2 / (Fast Period + 1)
Slow Alpha = 2 / (Slow Period + 1)
Speed Gate = rho^Coherence Power x Support
Adaptive Alpha = Slow Alpha + (Fast Alpha - Slow Alpha) x Speed Gate
Raw VCMA = Previous Raw VCMA + Adaptive Alpha x (Source - Previous Raw VCMA)
Alphaは常に、選択したSlowとFastの範囲内に収まります。Coherence Powerは速度変化のカーブを調整します。値を大きくするほど、rhoが1に近づかない限り、VCMAは大きく加速しにくくなります。
5. 出力WMA
チャートに表示されるラインは、生の適応結果に加重移動平均を適用したものです。
VCMA = WMA(Raw VCMA, Output WMA Length)
初期設定の3期間WMAは、わずかな追加遅延に抑えながら、小さな折り返しを滑らかにします。Output WMA Lengthを1に設定すると、この追加平滑化を無効にし、生の適応コアを表示できます。
数学的な考え方
VCMAは、1次元の価格経路効率を2次元の遅延座標経路へ拡張し、さらに単発のショックによる過度な加速を抑える有効変動ゲートを組み合わせた、特徴的な適応型移動平均線です。
遅延価格点 X(t) = が1本の経路を形成し、その各ステップがベクトル になります。コヒーレンス比率は、経路の正味変位を実際に移動した総距離で割ったものです。これにより、直近の遅延経路がどれだけ直線的で、方向がどれだけ一貫しているかを測定します。1次元の比率とは異なり、価格変化の符号が同じであっても、隣り合う変化の関係が不規則なら、その違いを捉えることができます。
有効変動ゲートは、さらに寄与の集中度を確認します。ベクトル・コヒーレンスは方向の整合性を測り、有効変動の支持度は、その整合性が十分な数の値動きに分散しているかを評価します。VCMAが加速するのは、両方の条件がそろった場合だけです。
その結果、VCMAの適応コアは現在および過去のデータだけで計算され、価格尺度に依存せず、反応速度にも明確な上下限があります。将来の価格を先取りして投影することはなく、最後のWMAも正の重みだけを使用します。VCMAも移動平均線である以上、遅延そのものは残ります。その目的は、観測された価格経路の構造に応じて、反応遅延の度合いを調整することです。
特徴と利点
• トレンド分類を組み込まない、シンプルな単色表示
• 価格尺度に依存しないベクトル・コヒーレンス測定
• 解釈しやすいFast PeriodとSlow Periodの範囲内で反応
• 単発の価格ショックによる過度な加速を抑制
• Coherence Powerによる非線形反応の調整
• 短期WMAによる任意の最終平滑化
• TradingViewのデータウィンドウで内部診断値を確認可能
チャート上でのVCMAの見方
VCMAは常に1つの固定色で表示され、色そのものに方向や相場状態の意味はありません。ラインの傾き、価格との位置関係、そしてVCMA付近での価格の動きを読み取ります。
傾き
VCMAが上昇している場合は、適応型の基準線が切り上がっていることを示します。下降している場合は、基準線が切り下がっていることを示します。ラインが横ばいに近づく場合は、直近の方向性が弱まっているか、値動きの一貫性が低下している可能性があります。
価格との位置関係
上向きのVCMAより上で価格が推移していれば、強気トレンドの解釈を補強します。下向きのVCMAより下で価格が推移していれば、弱気トレンドの解釈を補強します。価格の位置とラインの傾きを組み合わせる方が、どちらか一方だけを見るよりも有用です。
距離とクロス
価格とVCMAの距離が広がる動きは、強いモメンタムを表す一方で、適応型の基準線から価格が行き過ぎている可能性も示します。市場構造が維持されている場合、VCMA付近への押し目や戻りはトレンド判断の参考になります。価格がVCMAを何度も往復する場合は、方向感が定まっていないかレンジ相場であることが多く、移動平均線を基準にする有効性は低下します。
データウィンドウの診断値
• VCMA Coherence Score - 生のベクトル・コヒーレンスに変動支持度を掛けた値
• VCMA Raw Vector Coherence - 支持ゲートを適用する前の方向整合性
• VCMA Effective-Move Support - ベクトルの大きさがどの程度広く分散しているか
• VCMA Adaptive Alpha - 生の適応コアが実際に使用した平滑化係数
Raw Vector Coherenceが高くてもSupportが低い場合、1つの支配的なイベントに対して、ほかの値動きによる裏付けがまだ不足していることが多いと考えられます。コヒーレンスと支持度がともに高くなると、AlphaはFast側の上限へ近づくことができます。
設定項目
Source
VCMAの計算に使用する価格系列を選択します。初期設定はCloseです。
Coherence Length
ベクトルの整合性を測定する期間を設定します。短くすると適応が速くなり、長くするとより広い価格経路を評価するため、通常は変化が緩やかになります。
Fast PeriodとSlow Period
最速時と最遅時の反応を定めます。Fast Periodを短くすると最大反応速度が上がります。Slow Periodを長くすると、コヒーレンスまたは支持度が弱い場面でVCMAがより慎重に反応します。
Coherence Power
値を大きくすると、中程度のコヒーレンスによる影響をより強く抑え、rhoが1に近い場合にだけ速い反応を許します。値を小さくすると、より早い段階から滑らかに加速します。
Effective Moves for Full Speed
完全な支持度に達するために必要な、値動きの分散度を設定します。値を大きくすると単発の変動をより強く抑えられますが、本物のトレンドが始まった直後の加速も遅れる可能性があります。
Output WMA Length
最終平滑化の強さを設定します。値を大きくするとラインは安定しますが、遅延も増えます。1に設定すると、この平滑化を無効にできます。
実践的な使い方
VCMAは、適応型のトレンド基準線、押し目・戻りの参考線、方向フィルター、またはほかのインジケーターと組み合わせる数学的なベースラインとして利用できます。状態ごとの色分けやクロス判定を内蔵しないため、移動平均線そのものを直接読み取りたい場合に適しています。
VCMAは将来の価格を予測するものではなく、頻繁な往復やダマシを完全に排除することもできません。設定は銘柄、時間足、想定する保有期間に合わせて調整し、価格構造、ボラティリティ、出来高、上位時間足の状況も補足材料として利用してください。
インジケーター

Micro Momentum Oscillator [DYNA]Micro Momentum Oscillator is a purpose-built momentum tool for scalpers who need to know the instant short-term momentum shifts direction. It doesn't just tell you whether RSI is high or low -- it measures how fast RSI is changing and fires a signal the moment that rate of change flips in an extreme zone.
Most oscillators lag behind price on micro timeframes. By the time a standard RSI or MACD prints a crossover on a 1-minute chart, the move is already half over. Micro Momentum Oscillator solves this by applying a rate-of-change calculation directly to RSI and smoothing the result with a weighted moving average. The output is a fast, responsive line that turns teal when momentum is accelerating upward and red when it is accelerating downward -- giving you a clean visual read on who is in control right now.
Key Features
RSI Rate-of-Change Pipeline -- Measures how quickly RSI itself is changing, not just its level. This catches momentum shifts before the RSI line visually turns.
OB/OS Zone Flip Detection -- Signals only fire when momentum flips direction while RSI was in an extreme zone (oversold or overbought), filtering out noise in the middle range.
Color-Coded Momentum Line -- Teal for bullish acceleration, red for bearish acceleration. No interpretation needed -- the color tells you the direction at a glance.
Zone Shading -- Soft red and teal fills in the overbought and oversold momentum zones so you can instantly see when the oscillator is in an extreme area.
Confirmed-Bar Logic -- All signals reference the previous bar's values, so flip markers never repaint or disappear after they print.
How It Works
The oscillator computes a short-period RSI (default 5), then calculates the rate of change of that RSI over the last 3 bars. This raw ROC is smoothed with a 3-period weighted moving average to filter out single-bar noise while keeping the reading fast.
The result is plotted as a line that oscillates around zero. When the line is above zero and teal, momentum is pushing RSI higher -- buyers are gaining strength. When the line is below zero and red, momentum is dragging RSI lower -- sellers are in control.
The key signal is the momentum flip . When the oscillator crosses above zero and RSI was recently in the oversold zone (below 30), a bullish FLIP marker appears. When it crosses below zero and RSI was in the overbought zone (above 70), a bearish FLIP marker appears. These flips highlight the moments when exhausted momentum reverses direction at an extreme -- exactly the kind of micro-reversal scalpers look for.
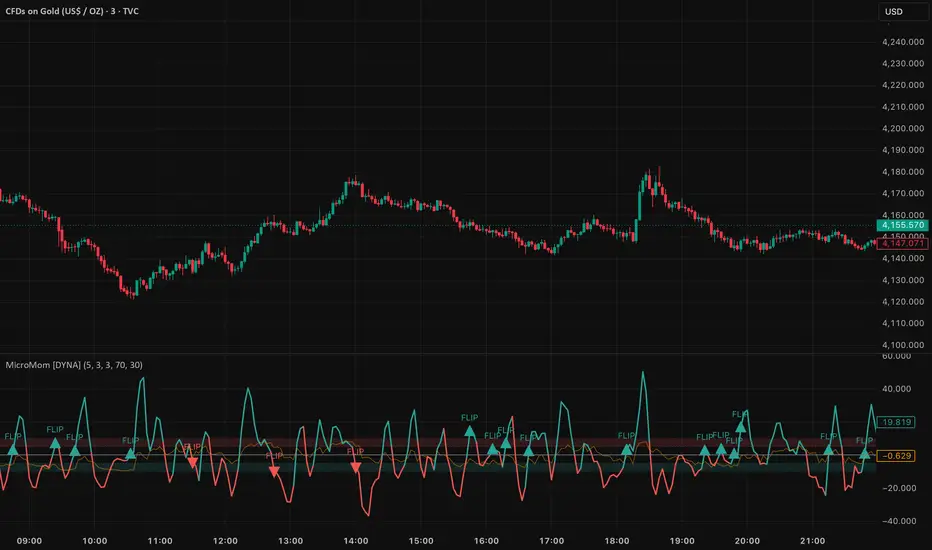
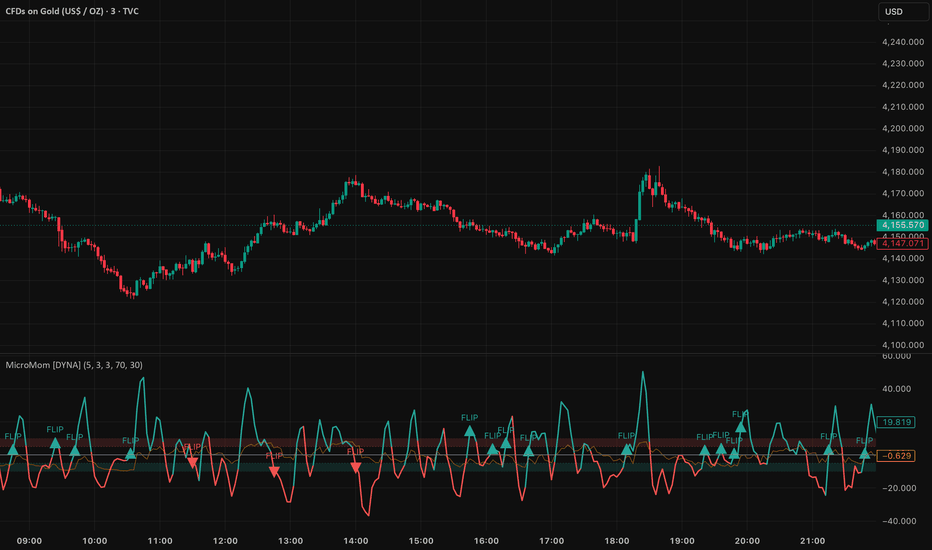
Micro Momentum Oscillator on a 1-minute BTC chart showing bullish and bearish flip signals at momentum extremes.
Visual Elements
The oscillator pane shows a teal/red momentum line, a gray zero line, and soft zone shading in the overbought and oversold areas. A thin orange reference line tracks the underlying RSI (scaled to fit the pane) so you can see at a glance whether price is stretched. Triangle markers with "FLIP" text appear at momentum reversal points in extreme zones.
Zone shading highlights overbought and oversold momentum areas. The orange RSI reference line shows underlying conditions.
Settings
The core settings control the speed of the oscillator. RSI Length (default 5) sets the underlying RSI period -- lower values make it more reactive. ROC Length (default 3) controls how many bars of RSI change are measured. Smoothing (default 3) applies a WMA to the ROC output to remove noise without adding significant lag.
Overbought and Oversold levels (default 70 and 30) define the RSI thresholds for flip detection. Only momentum reversals that occur when RSI was beyond these levels generate flip markers. You can tighten these thresholds (e.g., 75/25) for fewer but higher-conviction signals, or widen them (e.g., 65/35) for more frequent signals.
Visual toggles let you show or hide zone shading and flip markers. Alert toggles let you enable or disable each alert type independently.
Alerts
Momentum Flip Bullish -- Fires when the smoothed ROC crosses above zero while RSI was in the oversold zone. "Micro Momentum Oscillator : Bullish momentum flip detected. RSI was oversold, ROC now accelerating upward."
Momentum Flip Bearish -- Fires when the smoothed ROC crosses below zero while RSI was in the overbought zone. "Micro Momentum Oscillator : Bearish momentum flip detected. RSI was overbought, ROC now decelerating downward."
To set up alerts: click the TradingView Alerts button, select "Micro Momentum Oscillator " from the indicator dropdown, choose "Any alert() function call" as the condition, and set your preferred notification method.
Best Practices
Use on 1-3 minute charts for best results. The default parameters are calibrated for micro-timeframe scalping.
Treat FLIP signals as timing cues, not standalone entries. Confirm with a supporting candle pattern, a volume spike, or a key support/resistance level.
Avoid trading flips during low-volume periods such as pre-market or lunch hours when momentum readings become noisy.
If moving to 5-minute charts, consider increasing RSI Length to 8-10 to maintain signal quality.
Pair with a volume indicator or tape reader for stronger confirmation on each flip.
Part of the DYNA Ecosystem
Micro Momentum Oscillator is a free indicator built with the same design standards as the DYNA premium suite. For complete trade management with automatic stop loss, break-even, trailing stops, and multi-target systems, explore the full DYNA indicator collection.
Disclaimer
This indicator is a technical analysis and educational tool only -- it is not financial advice and makes no guarantee of any outcome. Past performance does not predict future results. Always do your own research and use proper position sizing and risk management.
Created by Varun Nidhi · varunnidhi.com
A free DYNA indicator — self-contained, no repainting.
インジケーター
インジケーター

Reverse AVWAP: Institutional Anchor DiscoveryStop guessing your anchors. Let the algorithm find them for you.
Most traders use the Anchored VWAP (AVWAP) the same way: they pick an obvious swing high, swing low, or earnings gap, anchor a line to it, and wait to see if price reacts. But what if we flipped the script? What if we took a significant current price level and mathematically scanned history to find exactly which hidden dates are defending it?
Introducing the Reverse AVWAP.
This indicator acts as an investigative tool for market structure and volume memory. By targeting a specific date or your current real-time chart bar, the script calculates backward, scanning thousands of bars to find the exact historical anchor points where an AVWAP drawn from them converges perfectly with your target price.
How It Works
Instead of projecting forward, this script reverse-engineers the volume profile:
Dynamic Target Selection: Choose to run the calculation from a fixed Target Date or toggle Use Last Chart Bar as Target to dynamically track live, real-time convergence on your current candle.
Historical Matrix Scan: The algorithm searches back in time, calculating the exact AVWAP from every single historical bar up to your target.
Threshold Matching: If a historical AVWAP lands within your custom proximity threshold (e.g., ±2.5% or ±3.5%) of the target price, it flags that date as a valid "Anchor."
Stitched Curve Generation: It draws the historical VWAP curves connecting those hidden anchors directly to your target.
Key Features
Macro First vs. Micro First Scanning: Choose your search direction. Macro First scans from the oldest historical data forward, prioritizing dominant multi-year structural pivots (like All-Time Highs or major cyclical bottoms). Micro First scans from recent data backward, focusing on short-term accumulation zones.
Smart Anti-Clustering: Includes a "Minimum Bars Between Anchors" filter. If the market forms a major rounded peak or flat consolidation, this prevents the script from grabbing 5 consecutive days on the same structure. It forces the algorithm to find distinct, uniquely significant pivot origins.
Up to 15 Historical Curves: Automatically color-codes and plots multiple unique historical AVWAP curves that converge on your target price.
Precision Divergence Labels: Drops clean visual tags on the discovered anchors, showing you exactly how close the historical AVWAP came to your target price down to the decimal percentage.
Under the Hood (Engine Optimizations)
Calculating thousands of historical AVWAPs iteratively would normally trigger a Pine Script timeout or cause massive lag. This indicator utilizes a heavily optimized architecture to bypass TradingView's native limitations:
O(1) Time Math: It uses rolling arrays to track the cumulative sums of Volume and Price × Volume. By subtracting cumulative historical values from current ones, it solves the AVWAP equations instantly in constant time per bar.
Bulletproof Line-Chain Renderer: TradingView’s standard polyline engine frequently suffers from canvas rendering drops when drawing long curves across thousands of bars. This script implements a custom, lightweight rendering engine that segments standard lines into roughly 80 dynamically downsampled links per anchor. The result is a buttery-smooth curve that never fails to render, no matter how far back the anchor sits.
Memory Management: Includes a dedicated garbage-collection routine that wipes and redraws canvas objects on live ticks, keeping your chart clean, responsive, and completely free of visual flickering.
Usage Tips
The History Loading Shortcut: Pine Script can only analyze data that is actively loaded into your browser session. If you are looking for a macro anchor from years ago, use the TradingView "Go to" shortcut (Alt + G on Windows, Option + G on Mac) and enter a past date. This forces the servers to load the historical bars instantly, allowing the script to find the anchor immediately.
Validation: If you see a breakout, run the Reverse AVWAP. If multiple historical volume anchors perfectly align with your current price, you have high-conviction proof of a major institutional volume node. You can then use those newly discovered anchor dates to project standard AVWAPs forward into the future. インジケーター
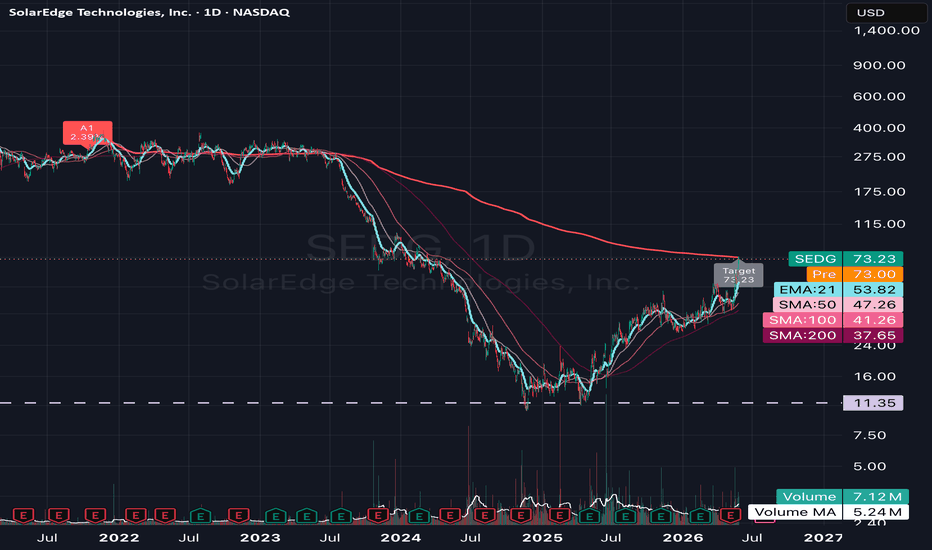
Bitcoin WMA Bands | Astral Vision Bitcoin WMA Bands | Astral Vision 💠🌠
This indicator constructs a volatility-adjusted band system around a Weighted Moving Average of price, using the standard deviation of logarithmic daily returns as the volatility measure rather than the standard deviation of price itself. The result is a channel whose width adapts dynamically to the current volatility regime, expanding during high-volatility periods and contracting during low-volatility ones, while remaining anchored to the WMA as the structural fair value reference.
Calculation ⚙️
The base reference line is a Weighted Moving Average of close over a configurable lookback in days. WMA weights recent bars more heavily than older ones using a linearly declining weight schedule, making it more responsive to recent price action than an SMA of the same length while being less erratic than an EMA.
The volatility measure is computed from logarithmic returns: for each bar, the log return is log(close / close ). The standard deviation of these log returns over a configurable lookback window is then multiplied by a configurable scale factor to produce the band half-width `s`. Using log returns rather than raw price changes ensures that the volatility measure is proportional across different price levels, making a 5% move at $10,000 and a 5% move at $100,000 contribute equally to the standard deviation.
The four bands are then computed as: band = WMA × exp(±n × s), where n is 1 or 2. The exponential transformation converts the log-space deviation back to price-space, ensuring the bands are multiplicatively symmetric around the WMA rather than additively symmetric. This means the upper and lower bands are equidistant in percentage terms rather than in absolute dollar terms.
The oscillator in the sub-panel is the log ratio of close to the WMA: log(close / WMA), which measures in log-space how far price has deviated from its trend. The same ±1σ and ±2σ levels are plotted in the sub-panel, allowing direct visual comparison of the oscillator's position within the band structure. Candles on the price chart are colored only when price is outside the ±1σ band, leaving them neutral in the fair value zone between the bands.
Crossover signals are generated when the oscillator crosses back inside the ±1σ boundary from outside: a triangle appears above the bar when the oscillator crosses back below the upper +1σ level from above, and below the bar when it crosses back above the lower -1σ level from below.
Plots 📊
WMA reference line on the price chart
Four volatility-adjusted bands at ±1σ and ±2σ on the price chart
Candle coloring on the price chart when price is outside the ±1σ band
Background color on the price chart between the ±1σ and ±2σ zones
Re-entry signals: triangle above bar on upper band exit, triangle below bar on lower band exit
Log-ratio oscillator in the sub-panel with matching ±1σ and ±2σ reference lines
Inputs 🎛️
STH Length: WMA lookback period in days
StDev Length: rolling window for the log return standard deviation
Band Scale: multiplier applied to the standard deviation before computing band width
Colors 🎨
5 Astral Vision presets + custom override. Default: Paradiso.
Purpose 🎯
Standard Bollinger Bands apply a fixed standard deviation multiple to a simple moving average computed on raw prices, which means the band width in percentage terms varies across different price levels and the bands do not correctly represent proportional deviations. This indicator applies the volatility measure in log-return space and converts back with the exponential function, producing bands that are geometrically consistent across Bitcoin's full price history. The WMA further reduces the lag of the central reference compared to an SMA, making the band system more responsive to trend changes without introducing the instability of shorter lookbacks.
Disclaimer ⭕️
This indicator is for informational and educational purposes only. It does not constitute financial advice. Past performance is not indicative of future results. Always do your own research before making investment decisions. インジケーター

インジケーター

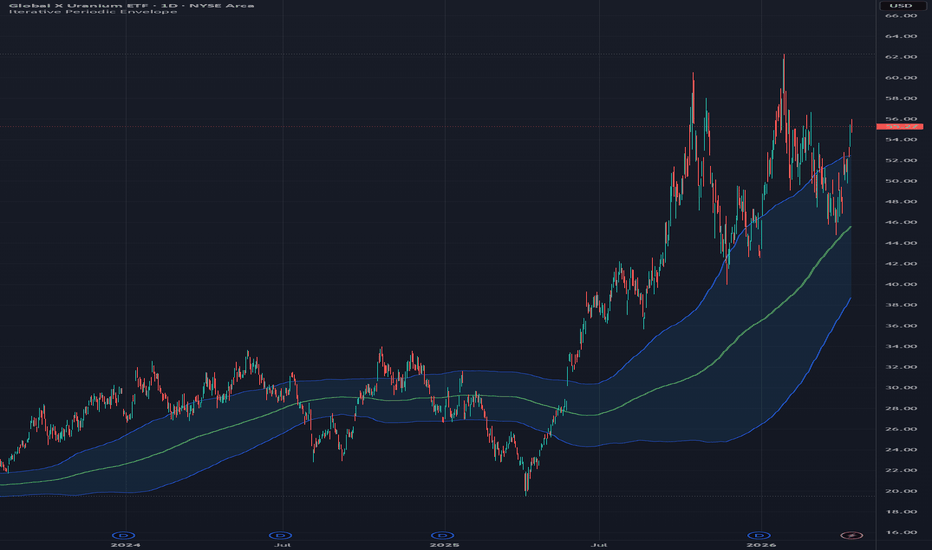
Iterative Periodic EnvelopeThe Iterative Periodic Envelope is a phase-conditioned kernel estimator with endogenous dispersion modeling, implemented as a Nadaraya–Watson estimator under a canonical periodic kernel.
The periodic kernel defines similarity through cyclical phase alignment rather than temporal proximity or multi-scale distance decay. Observations contribute to the estimator based on their position within a repeating cycle structure, emphasizing structural recurrence over linear time dependence.
The indicator computes a latent equilibrium using a kernel-weighted mean and a dispersion measure using kernel-weighted variance under the same weighting structure. The resulting envelope reflects cycle-consistent deviation, rather than a conventional volatility band. All values are computed exclusively on closed historical bars using a bounded lookback window, ensuring non-repainting behavior.
This indicator belongs to a broader class of iterative kernel-based envelopes that includes Gaussian and Rational Quadratic variants. All share a common Nadaraya–Watson estimation framework, differentiated by their kernel.
TRADING USES
The Iterative Periodic Envelope is best interpreted as a cycle-aware structural estimator rather than a volatility-based band.
Equilibrium Tracking
The latent equilibrium represents the phase-conditioned central tendency of price under periodic similarity weighting. Oscillations around this level reflect movement within a repeating structural cycle rather than directional drift.
Cycle Regime Structure
The envelope emphasizes repeating structural behavior through phase recurrence weighting. Changes in symmetry, amplitude, or persistence of oscillation around the latent equilibrium may indicate transitions between cyclical regimes.
Mean Reversion Within Cycles
When a stable periodic structure is present, deviations from the latent equilibrium may revert toward phase-consistent levels. This supports mean-reversion behavior that is conditioned on cycle structure rather than purely statistical dispersion.
Structural Extremes
Extreme deviations relative to the envelope correspond to phase-inconsistent states where cyclical structure becomes stretched or destabilized. These conditions often precede transitions such as cycle inversion, expansion, or compression.
State Estimation
The system defines a latent equilibrium as the inferred central cyclical state, with dispersion derived from kernel-weighted variance under identical periodic similarity constraints. This produces a structurally consistent representation of market state.
PERIODIC ENVELOPE CONSTRUCTION
The envelope is constructed using kernel-weighted variance under the same periodic similarity measure used to estimate the latent equilibrium. The latent equilibrium defines the central state estimate and kernel-weighted variance defines dispersion under identical weighting, producing an endogenously determined envelope. The band width is fixed at ±1 kernel standard deviation with no multiplier, ensuring dispersion remains an intrinsic property of the periodic similarity structure rather than an externally imposed scaling parameter.
THEORY
The periodic kernel defines similarity in terms of cyclical phase recurrence rather than linear temporal distance. Observations contribute to the estimator based on alignment within a repeating cycle structure.
The estimator is formulated as a Nadaraya–Watson kernel regression under a canonical periodic kernel, where weights are defined as:
k(i) = exp( -2 · sin²(πi / p) / L² )
Where:
p = period (cycle length)
L = lookback window (bandwidth parameter; effective smoothing scales with L²)
In this MacKay consistent formulation, the lookback window acts as a bandwidth control parameter, governing phase selectivity and structural smoothing. As L increases, the kernel becomes broader, producing stronger smoothing and reduced phase sensitivity. As L decreases, phase selectivity increases and the estimator becomes more locally sensitive to cyclical alignment.
This induces a cyclical similarity structure in which influence concentrates at recurring phase intervals. The resulting estimator defines a latent equilibrium governed by phase alignment rather than temporal proximity. This formulation can be interpreted as a periodic extension of kernel regression on a circular phase manifold.
CALIBRATION
Length (Lookback / Bandwidth)
Controls structural depth of the estimator and acts as the primary kernel bandwidth parameter.
- 50–100: high responsiveness, short-cycle sensitivity
- 150–250: balanced regime stability
- 300+: strong structural smoothing, reduced sensitivity to phase noise
Period (Cycle Length)
Defines the recurrence interval of the kernel and governs phase alignment and cyclical structure. Commonly aligns with dominant market rhythms such as intraday or macro-cycle structure.
- Lower values: faster cycle sensitivity
- Higher values: slower, broader structural cycles
Start At Bar
Offsets the kernel window backward from the most recent bars and excludes newer observations from the estimator. This ensures all calculations are based strictly on closed historical data and preserves non-repainting behavior.
MARKET USAGE
Stock, Forex, Crypto, Commodities, and Indices.
Performance is dependent on the presence of stable cyclical structure; in regimes lacking periodic coherence, the estimator converges toward a smoother, low-information state. インジケーター
インジケーター

インジケーター
インジケーター

ストラテジー

インジケーター
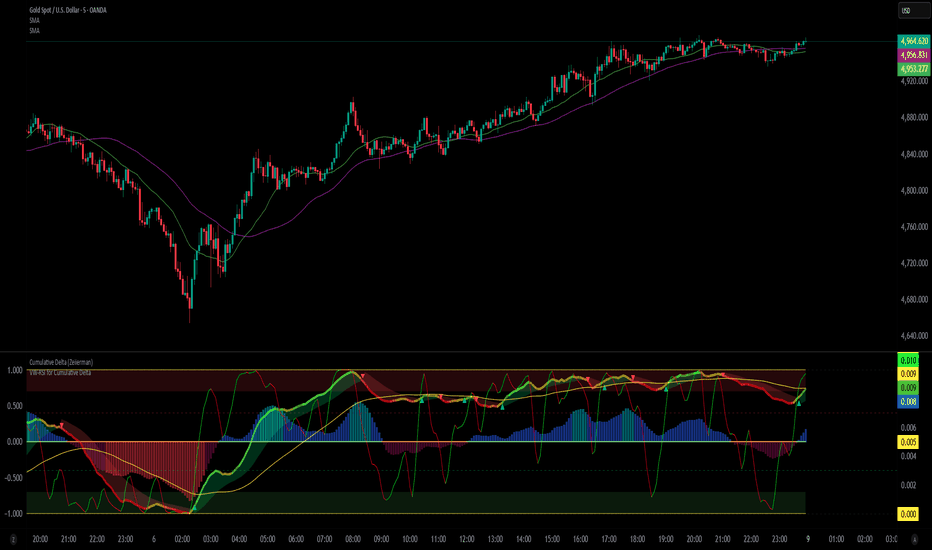
Rhokeo-VW-RSI Histogram for Cumulative Delta by ZeiirmanRhokeo-VW-RSI Histogram: Volume-Weighted Momentum (use with Cumulative Delta from Zeiierman) Note that Cumulative Delta is a paid indicator.
Overview: The Rhokeo-VW-RSI Histogram is a momentum oscillator designed to filter out market noise by integrating volume directly into the RSI calculation. Unlike a standard RSI, which only considers price change, this indicator weights those changes by the volume occurring at the time.
It creates a momentum profile in the form of a Histogram. If the price moves on high volume, the indicator reflects that strong market interest through its volume-weighted gain and loss calculations. It is particularly effective as a complementary filter for “Cumulative Delta” from Zeiierman to confirm the strength behind a move before you enter a trade.
How It Works The indicator operates on a normalized scale of -1.0 to +1.0 for easier visual interpretation and compatibility with Cumulative Delta indicator:
• The Volume-Weighted Core: Gains and losses are calculated by multiplying the price change by volume to ensure the "Relative Strength" reflects true capital flow.
• Smoothing for Clarity: The raw Volume Weighted RSI (VW-RSI) is processed through a customizable Moving Average—such as SMA, EMA, SMMA, WMA, or VWMA—to produce the smooth histogram.
• Four-Zone Coloring System: The histogram changes color dynamically based on momentum intensity:
o Strong Bull: Price is trending up with high-volume conviction.
o Weak Bull: Positive momentum, but not yet overextended.
o Weak Bear: Negative momentum starting to build.
o Strong Bear: Heavy selling pressure with high-volume conviction.
Key Features
• Shading: The background features optional red and green shading in the "Extreme" zones to warn traders of potential exhaustion areas.
• Dynamic Zero Line: The center line flips color between Green and Red based on whether the VW-RSI is positive or negative.
• Customization: Traders can adjust the smoothing length, source price, and the specific levels for overbought/oversold zones.
Best Use Case for New Traders: New traders often get "faked out" by price spikes that have no volume behind them. This indicator helps confirm and time better entries:
1. Wait for your Cumulative Delta indicator to give a signal.
2. Check the VW-RSI Histogram and whether it confirms or not.
3. Long Entry: Only enter if the histogram is positive and rising (above 0).
4. Short Entry: Only enter if the histogram is negative and decreasing (below 0).
________________________________________
Disclaimer
Financial Risk:
• Trading involves significant risk, and most traders lose money.
• This indicator is a tool for technical analysis and does not constitute financial, investment, or trading advice.
• Past performance is not indicative of future results; never trade with money you cannot afford to lose.
Usage & Reliability:
• The Rhokeo-VW-RSI Histogram is provided "as-is" for educational and informational purposes only.
• While volume-weighting aims to filter market noise, no indicator can guarantee 100% accuracy or predict future market movements with certainty.
• This script is intended to be a complementary tool that works well with other indicators in this case the Cumulative Delta from Zeiirman; it should be used in conjunction with other forms of analysis, risk management, and your own due diligence.
Commercial Notice:
• If you are using this alongside a third-party paid indicator, please note that I am not responsible for the performance or support of external products.
• Users are responsible for their own trade execution and account management.
インジケーター
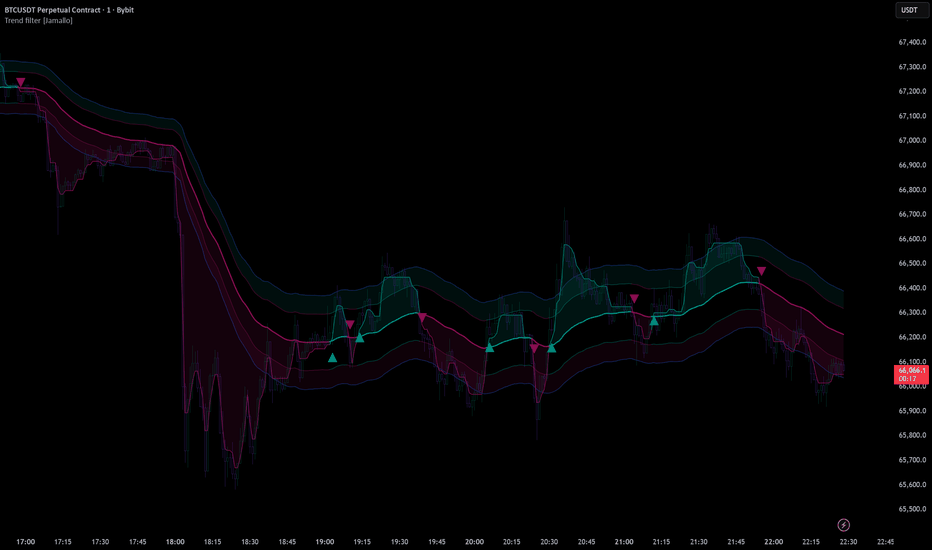
WMA MAD Trend | RakoQuantWMA MAD Trend | RakoQuant is a robust volatility-regime trend system built on Weighted Moving Average structure and Median Absolute Deviation dispersion, engineered to produce clean directional states while suppressing wick-driven noise and unstable ATR distortions.
This tool belongs to the RakoQuant protected research line, combining a smooth WMA baseline, statistically robust volatility envelopes (MAD bands), SuperTrend-style regime logic, and a strength-aware visualization layer designed for consistent performance across trending, mean-reverting, and mixed market environments.
Core Concept
This indicator answers one fundamental question:
Is price holding a statistically meaningful deviation from its WMA baseline, or reverting back into range?
Unlike classic SuperTrend variants that rely on ATR (highly sensitive to spikes and wicks), WMA MAD Trend uses Median Absolute Deviation as its volatility engine — a robust dispersion measure that remains stable in the presence of outliers.
How It Works
1) WMA Baseline (Directional Structure)
At its core, the indicator defines the market’s structural center using a Weighted Moving Average:
* WMA Baseline tracks directional bias with smoother, trend-weighted responsiveness
* The baseline can optionally be smoothed further in intraday mode to reduce micro-chop
This provides a stable anchor for dispersion-based regime classification.
2) MAD Volatility Engine (Robust Dispersion Core)
Instead of ATR, volatility is measured via Median Absolute Deviation (MAD) around the baseline:
* Compute absolute deviation:
|Close − Baseline|
* Take rolling median of deviation over madLen
* Optional normalization scales MAD toward a stdev-like measure (via constant factor)
This makes volatility estimation:
* Outlier-resistant
* Wick-resistant
* Regime-stable during abnormal price spikes
3) MAD Bands + SuperTrend Trailing Logic (Regime State Model)
Bands are built as:
* Upper Band = Baseline + Factor × MAD
* Lower Band = Baseline − Factor × MAD
Then classic SuperTrend-style trailing constraints are applied so the active band persists until a true regime break occurs.
That produces a state engine:
* Bull regime when price breaks above the trailing upper logic (transition into trend-up state)
* Bear regime when price breaks below the trailing lower logic (transition into trend-down state)
This behaves like a structural market regime model, not a reactive oscillator.
4) Strength Engine (Deviation-Based Intensity)
A defining layer of this tool is the MAD Z-score intensity system:
* Compute Z-score:
z = |Close − Baseline| / MAD
* Map into a 0 → 1 strength scale
Interpretation:
* Low deviation = weak regime confidence (likely chop / mean reversion)
* High deviation = strong regime confidence (trend expansion)
5) Intensity Visual Engine (Signal Clarity Layer)
WMA MAD Trend includes a protected visual engine that scales opacity with strength:
* Strong expansion = solid trend band
* Weak deviation = faded band
This gives immediate clarity:
Not all flips are equal — strength is displayed structurally.
6) Optional Institutional Filters
Two optional confirmation modules allow institutional-grade filtering:
Baseline Confirmation
* Bull flips only accepted if price is above baseline
* Bear flips only accepted if price is below baseline
EMA Stack Filter
* Bull only when Fast EMA > Slow EMA
* Bear only when Fast EMA < Slow EMA
These modules make the tool suitable for:
* Directional portfolio bias frameworks (RSPS)
* Regime classification overlays
* Trend confirmation filters for execution systems
7) Strong Flip Tier Alerts
Signal quality is tiered:
* Standard flip alerts
* Strong flip alerts only when deviation strength exceeds a threshold
This produces a higher-confidence regime transition model for swing positioning and exposure scaling.
How To Use
✅ Trend regime overlay
✅ Wick-resistant volatility trend filter
✅ MAD-based deviation strength engine
✅ Directional bias tool for portfolio systems
Best use cases:
* 1H–1D trend frameworks
* Regime filters for signal stacking
* Chop suppression in volatile markets
Suggested workflow:
* Bull bias when the regime is bullish and strength is rising
* Reduce risk / defensive when strength fades or a bearish flip occurs
* Pair with execution tools (breakout/mean-reversion entries) for timing
Screenshot Placement
📸 Example chart / screenshot: snapshot
インジケーター

6 Moving Averages (SMA, WMA, EMA etc.)6 Moving Averages is a simple and flexible overlay indicator that lets you plot up to six moving averages on the price chart. Each moving average can be customized by type (SMA, EMA, WMA, etc.), length, color, and visibility, making it ideal for trend analysis, dynamic support and resistance, and moving-average confluence across any market or timeframe. インジケーター

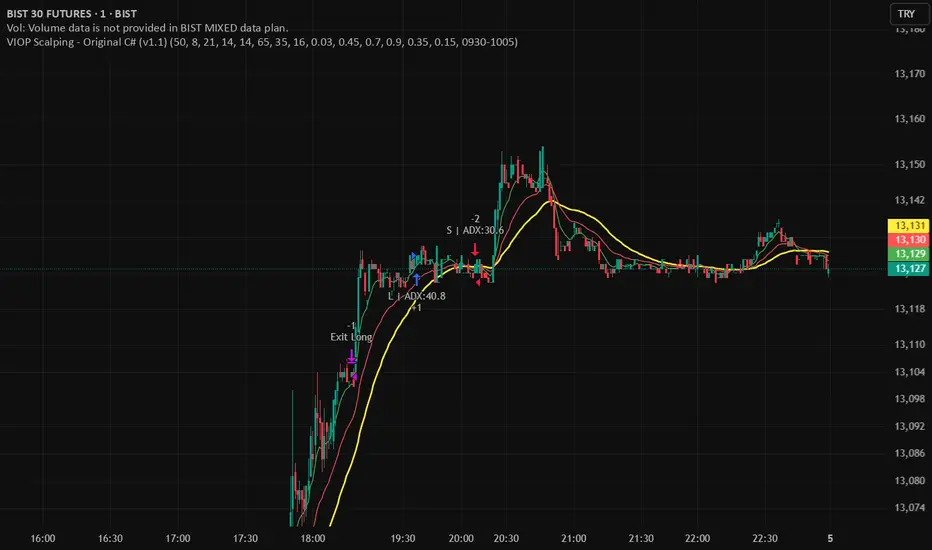
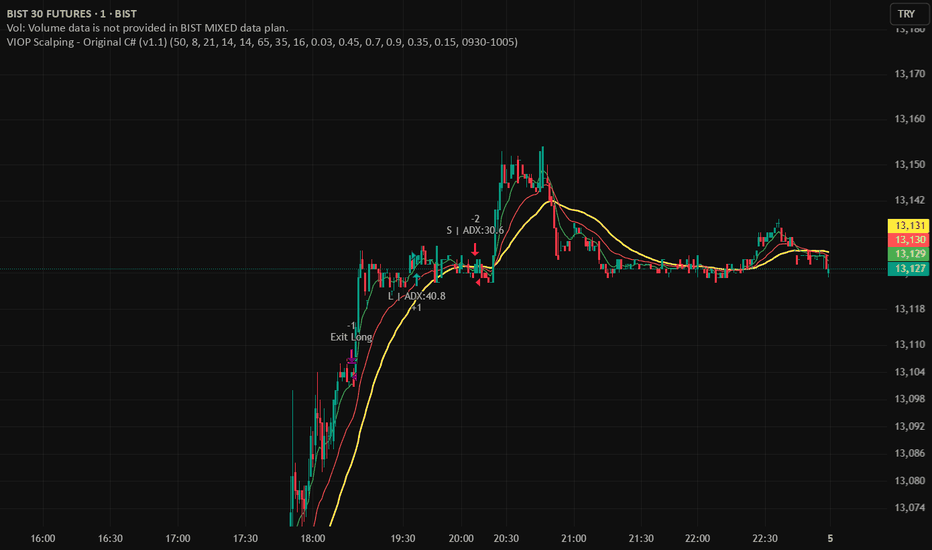
VIOP Scalping - OriginalVIOP Scalping – Original is a rule-based scalping strategy ported from an original C# logic set. It aims to trade only when trend direction, momentum, and trend strength align, then manages the position using fixed take-profit/stop-loss percentages with an optional trailing mechanism to protect gains during favorable moves.
This strategy is provided for educational and backtesting purposes only. It is not financial advice and does not guarantee profitability. Always test thoroughly before any live usage.
Core Concept
Follow the dominant WMA trend, confirm momentum with EMA separation, filter conditions with RSI + ADX, then exit using fixed TP/SL with trailing behavior after a defined profit threshold.
How the Strategy Works
Trend Direction is defined by WMA: above WMA = long bias, below WMA = short bias.
Momentum is measured via Fast EMA vs Slow EMA and the EMA difference.
Trend Strength is confirmed using ADX (must exceed a threshold).
RSI filters trades to avoid entering when momentum is likely overextended or weak.
A no-trade session blocks entries during a predefined time window (default 09:30–10:05).
Exit logic uses fixed percent TP/SL, with an optional trailing mechanism that activates after a profit threshold.
Inputs and Settings
Trend and Indicator Settings
Main Trend WMA: Determines directional bias (price above = long, price below = short).
Fast EMA / Slow EMA: Used to measure momentum and directional separation.
RSI Period: Filters entries based on RSI range constraints.
ADX Period: Measures trend strength (must exceed threshold to allow entries).
Threshold Settings
EMA Difference Threshold: Minimum EMA separation required to validate momentum.
ADX Threshold: Minimum ADX required to confirm trend strength.
RSI Long Ceiling: RSI must remain below this value for long entries.
RSI Short Floor: RSI must remain above this value for short entries.
Risk Management Settings
Take Profit %: Default TP distance in percent.
Strong Trend Take Profit %: Higher TP used when a “strong trend” condition is detected.
Stop Loss %: Fixed SL distance in percent.
Trailing Activation %: Profit threshold at which trailing starts.
Trailing Distance %: Trailing offset distance used once trailing is active.
Time Filter
No-Trade Hours: Default session is 09:30–10:05. During this window, the strategy does not open new trades.
Entry Logic
No-Trade Time Filter
If the current bar falls inside the no-trade session, entries are blocked.
Long Entry Conditions
Price is above the WMA trend line.
EMA difference is positive and greater than the EMA Difference Threshold.
EMA momentum is increasing (current EMA diff > previous EMA diff).
RSI is within the defined range (RSI > 48 and RSI < RSI Long Ceiling).
Close is higher than the previous close.
ADX is above the ADX Threshold.
Short Entry Conditions
Price is below the WMA trend line.
EMA difference is negative and lower than -EMA Difference Threshold.
Bearish momentum is increasing (current EMA diff < previous EMA diff).
RSI is within the defined range (RSI < 52 and RSI > RSI Short Floor).
Close is lower than the previous close.
ADX is above the ADX Threshold.
Strong Trend Logic (Dynamic TP Selection)
If price is far from the WMA (absolute distance > 20 points) AND EMA separation is strong (absolute EMA diff > 1.5 points), the strategy treats the environment as a strong trend.
In strong trend mode, the strategy uses “Strong Trend Take Profit %” instead of the default “Take Profit %”.
Exit Management (TP/SL + Trailing)
The strategy uses fixed percentage-based TP and SL levels.
Trailing logic is enabled via strategy.exit and activates only after price moves in profit by the defined Trailing Activation %.
Once activated, trailing follows price using the defined Trailing Distance % offset.
This is designed to secure partial gains during extended moves while still allowing room for continuation.
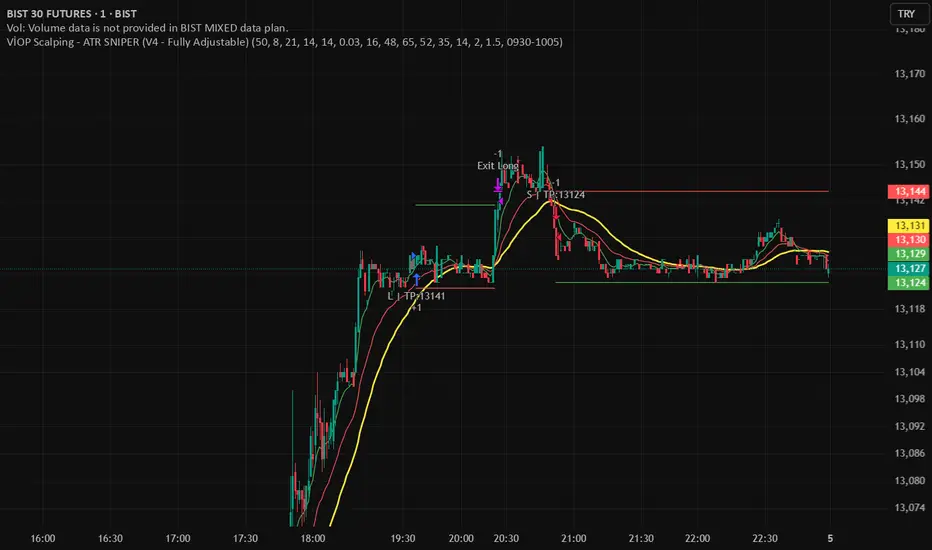
What You See on the Chart
WMA Trend Line (Main Trend Filter).
Fast EMA and Slow EMA (Momentum Confirmation).
Strategy entry/exit markers generated by TradingView.
Recommended Use
Scalping systems that rely on trend-following and momentum confirmation.
Markets where ADX filtering helps avoid choppy conditions.
Traders who want a simple, parameter-driven TP/SL system with trailing after confirmation.
Important Notes
The no-trade session depends on your chart/session settings. Ensure your symbol/session configuration matches your intended market hours.
Percent-based exits scale with price; results will vary across instruments and volatility regimes.
Always validate behavior using bar replay, forward testing, and realistic commission/slippage assumptions.
ストラテジー
ストラテジー

インジケーター

インジケーター

Hyper Insight MA Strategy [Universal]Hyper Insight MA Strategy ** is a comprehensive trend-following engine designed for traders who require precision and flexibility. Unlike standard indicators that lock you into a single calculation method, this strategy serves as a "Universal Adapter," allowing you to **Mix & Match 13 different Moving Average types** for both the Fast and Slow trend lines independently.
Whether you need the smoothness of T3, the responsiveness of HMA, or the classic reliability of SMA, this script enables you to backtest thousands of combinations to find the perfect edge for your specific asset class.
---
🔬 Deep Dive: Calculation Logic of Included MAs
This strategy includes 13 distinct calculation methods. Understanding the math behind them will help you choose the right tool for your specific market conditions.
#### 1. Standard Averages
* **SMA (Simple Moving Average):** The unweighted mean of the previous $n$ data points.
* *Logic:* Treats every price point in the period with equal importance. Good for identifying long-term macro trends but reacts slowly to recent volatility.
* **WMA (Weighted Moving Average):** A linear weighted average.
* *Logic:* Assigns heavier weight to current data linearly (e.g., $1, 2, 3... n$). It reacts faster than SMA but is still relatively smooth.
* **SWMA (Symmetrically Weighted Moving Average):**
* *Logic:* Uses a fixed-length window (usually 4 bars) with symmetrical weights $ $. It prioritizes the center of the recent data window.
#### 2. Exponential & Lag-Reducing Averages
* **EMA (Exponential Moving Average):**
* *Logic:* Applies an exponential decay weighting factor. Recent prices have significantly more impact on the average than older prices, reducing lag compared to SMA.
* **RMA (Running Moving Average):** Also known as Wilder's Smoothing (used in RSI).
* *Logic:* It is essentially an EMA but with a slower alpha weight of $1/length$. It provides a very smooth, stable line that filters out noise effectively.
* **DEMA (Double Exponential Moving Average):**
* *Logic:* Calculated as $2 \times EMA - EMA(EMA)$. By subtracting the "lag" (the smoothed EMA) from the original EMA, DEMA provides a much faster reaction to price changes with less noise than a standard EMA.
* **TEMA (Triple Exponential Moving Average):**
* *Logic:* Calculated as $3 \times EMA - 3 \times EMA(EMA) + EMA(EMA(EMA))$. This effectively eliminates the lag inherent in single and double EMAs, making it an extremely fast-tracking indicator for scalping.
#### 3. Advanced & Adaptive Averages
* **HMA (Hull Moving Average):**
* *Logic:* A composite formula involving Weighted Moving Averages: ASX:WMA (2 \times Integer(n/2)) - WMA(n)$. The result is then smoothed by a $\sqrt{n}$ WMA.
* *Effect:* It eliminates lag almost entirely while managing to improve curve smoothness, solving the traditional trade-off between speed and noise.
* **ZLEMA (Zero Lag Exponential Moving Average):**
* *Logic:* This calculation attempts to remove lag by modifying the data source before smoothing. It calculates a "lag" value $(length-1)/2$ and applies an EMA to the data: $Source + (Source - Source )$. This creates a projection effect that tracks price tightly.
* **T3 (Tillson T3 Moving Average):**
* *Logic:* A complex smoothing technique that runs an EMA through a filter multiple times using a "Volume Factor" (set to 0.7 in this script).
* *Effect:* It produces a curve that is incredibly smooth and free of "overshoot," making it excellent for filtering out market chop.
* **ALMA (Arnaud Legoux Moving Average):**
* *Logic:* Uses a Gaussian distribution (bell curve) to assign weights. It allows the user to offset the moving average (moving the peak of the weight) to align it perfectly with the price, balancing smoothness and responsiveness.
* **LSMA (Least Squares Moving Average):**
* *Logic:* Calculates the endpoint of a Linear Regression line for the lookback period. It essentially guesses where the price "should" be based on the best-fit line of the recent trend.
* **VWMA (Volume Weighted Moving Average):**
* *Logic:* Weights the closing price by the volume of that bar.
* *Effect:* Prices on high volume days pull the MA harder than prices on low volume days. This is excellent for validating true trend strength (i.e., a breakout on high volume will move the VWMA significantly).
---
### 🛠 Features & Settings
* **Universal Switching:** Change the `Fast MA` and `Slow MA` types instantly via the settings menu.
* **Trend Cloud:** A dynamic background fill (Green/Red) highlights the crossover zone for immediate visual trend identification.
* **Strategy Mode:** Built-in Backtesting logic triggers `LONG` entries when Fast MA crosses over Slow MA, and `EXIT` when Fast MA crosses under.
### ⚠️ Disclaimer
This script is intended for educational and research purposes. The wide variety of MA combinations can produce vastly different results. Past performance is not indicative of future results. Please use proper risk management. ストラテジー

インジケーター

インジケーター