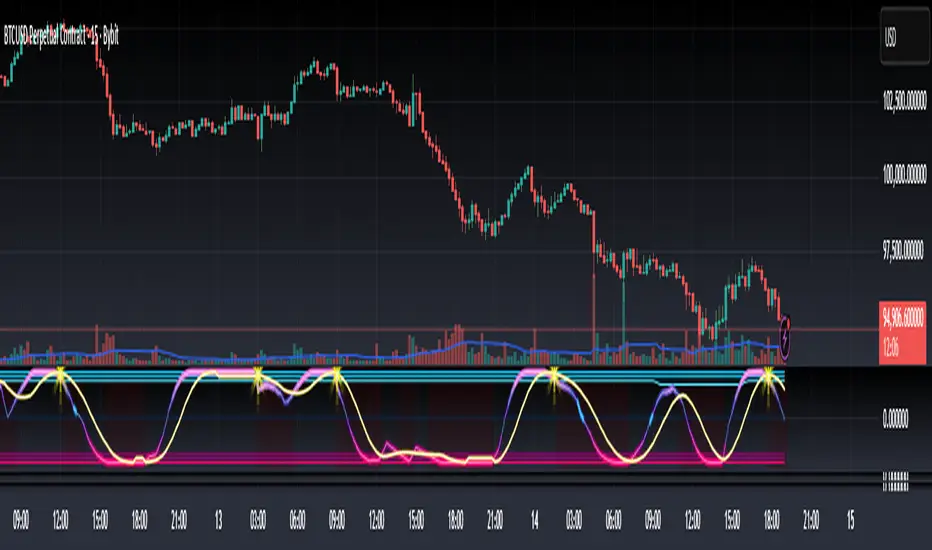
こちらはtheheirophantさんの有料スペースです。TradingViewから直接有料コンテンツにアクセスできるようになりました。有料スペースの詳細についてはこちら をご覧ください。 Bottom & Top Finder v3.0 Bottom & Top Finder v3.0 is a proprietary multi-component oscillator designed to identify potential market reversals and extreme price conditions. The indicator analyzes momentum, volatility, and price behavior to generate bullish and bearish signals with strength classification.
█ OVERVIEW
Each signal is classified into three strength levels (Weak, Medium, Strong) allowing traders to prioritize high-conviction setups.
Signal Classification:
• Strong signals (±1.0): High conviction setups with multiple confirmations
• Medium signals (±0.6): Moderate conviction with key component alignment
• Weak signals (±0.33): Early warnings or preliminary indications
█ KEY FEATURES
Smart Signal Management
The indicator includes an intelligent system that allows signal sequences to complete naturally while preventing excessive noise. Unlike traditional cooldown systems that block all signals during a cooldown period, this implementation allows consecutive signals during a "run" and only applies cooldown after the signal run ends. This ensures complete multi-bar patterns are captured while preventing rapid flip-flopping.
Advanced Filtering System
Three optional filters allow adaptation to different market conditions:
• Volume Confirmation Filter: Validates signals against recent volume activity across a configurable lookback period. Checks if any bar in the lookback window exceeded average volume by the specified multiplier.
• Trend Alignment Filter: Four operational modes including With Trend, Counter Trend, Statistical Distance, or Off. The anomaly mode uses calculations to identify signals only at statistical extremes rather than simple directional bias.
• Signal Type Selection: Enable or disable weak, medium, and strong signals independently based on your trading style and risk tolerance.
Comprehensive Alert System
Ten distinct alert conditions cover every use case. Alerts include price level and timestamp, and are ready for webhook integration with automated trading systems.
█ HOW TO USE
Basic Setup
1 — Add "Bottom & Top Finder v3.0" to your chart in a separate indicator pane
2 — Optionally add "Bottom & Top Finder v3.0 - Chart Labels" for on-chart visual markers
3 — Configure lookback periods (defaults work well for most timeframes)
4 — Enable or disable signal strengths based on your trading style
5 — Apply filters as needed to reduce noise in your specific market
Signal Interpretation
Histogram magnitude indicates signal conviction. Multiple signal types can fire simultaneously and are aggregated into the composite score.
Alert Configuration
Set up alerts through TradingView's standard alert system using the built-in alert conditions. Choose from individual signal types (for specific setups) or aggregate alerts (for broader monitoring).
Recommended Approach
• Combine indicator signals with price action and support/resistance analysis
• Use strong signals for entries, weaker signals for early warnings or exits
• Enable filters when trading liquid markets with reliable volume data
• Adjust cooldown period based on timeframe: lower for active trading, higher for swing setups
• Start with default settings and adjust based on backtesting results
█ SETTINGS
Lookback Settings
• Main Lookback Period: Primary calculation period for most components (default: 21). Lower values increase sensitivity, higher values smooth signals.
• Range Lookback: Extended lookback for range high/low analysis (default: 50). Affects extreme condition detection.
Signal Settings
• Enable Weak Signals: Toggle weak signal detection (default: on)
• Enable Medium Signals: Toggle medium signal detection (default: on)
• Enable Strong Signals: Toggle strong signal detection (default: on)
Filter Settings
• Enable Volume Filter: Require volume confirmation (default: off)
• Volume Lookback: Period to check for volume spikes (default: 30)
• Volume Spike Multiplier: Threshold above average volume (default: 1.3x)
• Trend Filter Mode: Off, With Trend, Counter Trend, or Anomaly (default: off)
• Trend SMA Period: Moving average period for trend calculations (default: 50)
• Anomaly Threshold: Minimum statistical deviation for anomaly mode (default: 1.5)
Display Settings
• Show Composite Histogram: Toggle main histogram display (default: on)
• Show Signal Bars: Toggle triangle markers in indicator pane (default: on)
• Show RSI Reference: Overlay normalized RSI for context (default: off)
█ TIMEFRAME CONSIDERATIONS
The indicator works on any timeframe from 1-minute to monthly charts. However, optimal performance requires timeframe-appropriate configuration:
Shorter Timeframes (1m-15m)
Consider reducing main lookback period for increased responsiveness. Volume filter may be less reliable in some markets during low-liquidity sessions.
Medium Timeframes (1H-4H)
Default lookback periods are optimized for these timeframes. Volume and trend filters provide good noise reduction.
Longer Timeframes (1D+)
Consider increasing lookback periods for smoother signals. Filters are highly effective at these timeframes.
█ BEST PRACTICES
Risk Management
This indicator is a technical analysis tool designed to identify potential reversal zones and does not guarantee profitable trades. Users should:
• Understand that signals indicate potential setup zones, not guaranteed outcomes
• Employ proper position sizing and risk management on every trade
• Combine indicator signals with their own analysis and trading strategy
• Paper trade and backtest thoroughly before live implementation
• Never risk more than they can afford to lose
Signal Context
Indicator signals should be evaluated within broader market structure. Consider:
• Proximity to key support and resistance levels
• Overall trend direction and strength
• Market volatility and liquidity conditions
• Confluence with other technical indicators or patterns
• Fundamental factors that may override technical signals
█ NOTES
• All signals use confirmed bar data and do not repaint
• The cooldown system tracks top and bottom signals independently
• Multiple signal types can fire simultaneously; the composite score aggregates them
• Anomaly mode measures standard deviation magnitude, not just directional bias
• Volume filter checks any bar in the lookback period, not just the current bar
• Strong signals require more confirmations than medium or weak signals Vicious Cycle 1.2 [CR] - Enhanced █ OVERVIEW
Vicious Cycle 1.2 is an advanced oscillator-based momentum indicator designed to identify high-probability reversal and continuation setups. This new version features adaptive threshold technology, visual trend state classification, and a higher timeframe alignment system to filter low-quality signals.
The indicator analyzes multiple timeframe components and market dynamics to generate a composite momentum score, which is then smoothed and compared against statistical thresholds. Unlike traditional static oscillators, Vicious Cycle adapts its sensitivity zones to current market conditions, reducing false signals during volatile periods and increasing responsiveness during consolidation.
█ FEATURES
Adaptive Threshold System
The indicator employs percentile-based threshold calculations that automatically adjust to recent market behavior. This ensures optimal signal generation across different instruments and market regimes without manual recalibration.
• Toggle between dynamic and fixed threshold modes
• Adjustable lookback period for threshold calculation (50-500 bars)
• Customizable percentile levels for sensitivity tuning
• Separate calibration for overbought and oversold zones
Visual Trend State Classification
Background coloring provides instant visual feedback on market condition strength without requiring analysis of indicator position. The six-state classification system combines oscillator position with signal line relationship to identify:
• Strong bullish momentum
• Moderate bullish bias
• Weak bullish condition
• Weak bearish condition
• Moderate bearish bias
• Strong bearish momentum
Higher Timeframe Trend Alignment
An optional filtering system analyzes higher timeframe trend direction to block counter-trend signals. Two modes are available:
• Single EMA Mode: Uses price position relative to a customizable moving average
• Dual EMA Mode: Employs fast and slow moving average crossover logic
The filter only permits long signals during bullish trends and short signals during bearish trends, significantly improving signal quality in trending markets.
Signal Detection Modes
Multiple signal generation methods accommodate different trading styles:
• Zone-Based Signals: Fires when oscillator crosses key threshold levels
• Signal Line Cross: Generates entries based on oscillator and signal line interaction
Comprehensive Alert System
Pre-configured alert conditions cover all major indicator events:
• Primary signal alerts (zone cross and signal line methods)
• Zone entry and exit warnings
• Extreme level notifications
• Trend filter status changes
• Convenience aggregators for "any long" or "any short" condition
█ HOW TO USE
Initial Configuration
The indicator ships with optimized default settings suitable for most instruments and timeframes. New users should observe the indicator's behavior for at least 50 signals before adjusting parameters.
1 — Add the indicator to your chart and leave default settings unchanged.
2 — Monitor signal generation and background color transitions for several trading sessions.
3 — Set up basic alerts using the "ANY LONG Signal" and "ANY SHORT Signal" conditions.
4 — After observation period, adjust sensitivity based on your instrument's characteristics.
Threshold Configuration
For instruments with higher volatility, increase the percentile values (example: 90/75 instead of 85/65). For ranging or lower volatility instruments, decrease percentile values (example: 80/60 or 75/55).
The lookback period controls how quickly thresholds adapt to changing conditions. Longer lookbacks (150-200) provide smoother adaptation, while shorter lookbacks (50-75) offer more responsive adjustments.
Trend Filter Guidelines
Enable the trend filter in clearly trending markets to reduce whipsaw trades. In ranging or choppy conditions, consider disabling the filter or using a shorter EMA period.
• For position trading: Use 200-period single EMA
• For swing trading: Use 150-period single EMA or 50/200 dual EMA
• For day trading: Use 100-period single EMA or 50/100 dual EMA
If the filter blocks all signals, the market may be ranging near the trend reference level. This is intentional behavior designed to keep you out of low-probability setups.
Signal Interpretation
Primary signals occur when the oscillator crosses threshold zones or intersects the signal line in extreme regions. The strongest setups combine:
• Signal generation in the expected direction
• Background color matching the trade direction (bright colors indicate high conviction)
• Trend filter alignment
• Price action confirmation at key support or resistance levels
█ NOTES
Alert Configuration
Alerts must be manually configured in TradingView and do not activate automatically. Access the alert menu by clicking the indicator name and selecting "Add Alert on Vicious Cycle 1.2...". Choose your desired condition from the dropdown menu and configure notification preferences.
We recommend starting with the aggregated "ANY" alerts rather than subscribing to all individual signal types, as this prevents notification overload during active market periods.
Dynamic Threshold Behavior
The adaptive threshold system requires sufficient historical data (minimum equal to the lookback period setting) to calculate percentiles accurately. During the initial bars, threshold values may appear unusual until adequate history accumulates. This is expected behavior and resolves automatically.
Performance Considerations
The indicator performs percentile calculations on each bar using array operations. While optimized for efficiency, users experiencing performance issues on lower-end devices may reduce the dynamic lookback period or disable the adaptive threshold feature to use fixed thresholds instead.
Compatibility
Vicious Cycle 1.2 is built on Pine Script version 6 and works on all instrument types and timeframes. The indicator does not repaint—all signals finalize at bar close. Historical signals remain stable and do not change with additional price data.
█ RISK DISCLOSURE
This indicator is an analytical tool and does not constitute financial advice. No indicator or trading system guarantees profitable results. Always employ proper risk management, position sizing, and stop-loss protocols. Past performance does not indicate future results. Users are responsible for their own trading decisions and outcomes. Trendgetter: Trend Detection, Regime Change, Bias Filter by [CR] Trendgetter: Trend Detection, Regime Change, Bias Filter by Cryptorhythms
“If you are not a trend setter, at least be able to exploit the ones you see.”
― Jeffrey Fry
Intro
Cryptorhythms back again with a members only indicator for trend capture this time! Trendgetter is not crypto specific and can be applied to a variety of timeframes, markets, and tickers. Its meant to be a general purpose trading aid and bias filter, providing reliable trend, bias and regime change information.
Introduction
This indicator relies upon various methods related to probabilities/statistics, digital signal processing and data science to predict optimal fair local price given any financial time series data. The goal was to create a tool that isolates trends and captures their bias, making it easier to follow a noisy market. The focus is making high hit rate uncorrelated returns to your base market. The way in which this indicator is constructed is not based upon any previous public work, and was researched and refined over a period of 6 months of trading and testing based on my own personal trading experiences and observations of the market. I use novel techniques I developed in house to denoise the data and determine a local fair price.
Description
The parameters in this indicator are mostly fixed and do not lend themselves to overfitting. So when you find good settings, its probably legit and not a false positive. They were pre-determined based on my own testing and research to handle almost all possible combinations of price action for determining trends. By fixing some parameters, you automatically reduce the chances of overfitting to historical data. The pre determined levels were carefully chosen after many options were considered.
Not just a bias filtooor, fair price predictooor and regime change detectoooor though! TG also provides a price envelope feature which shows a likely fair price range that price will distribute itself upon. Above or below the envelope indicates the presence of a very strong trend . Within the envelope indicates consolidation , but still conforming to the bias. TG then uses a statistics-based approach to display a likely range that price could potentially travel over the near term which we called a price envelope.
An additional option provides background coloration when there is the potential for a regime change on the trend bias. This can be used as a feature to help you manage your trades risk. This is simply measured by an internal (non exposed) script value returning to a mean which triggers the color to appear.
Further Explanation of Settings
-Timeframe : Change the timeframe the indicator is calculated on allowing you to for instance use the 15m Trendgetter output while remaining on the 5 minute chart.
-Trend Capture : This is the "type" of trend you are trying to follow. The different options will attempt to find the trends at various levels of noise cancellation within the lookback period you specify. "Reactive" means it will quickly change its bias and capture smaller trends. "Slow" means it will filter more noise and capture larger trends. "Adaptive" is completely in its own class of behavior and was my attempt to mix both a slow and reactive profile into one setting, it uses a few market metrics like volume and volatility to adjust parameters on the fly.
-Sample Length : Bars to consider in the calculation. Using large numbers here is not going to help, but rather hurt your results. Generally 10-100 is the range you should use for the best results. The exact value will depend on the timeframe, volatility and market/asset you are trading, and you should experiment to find it. (There is no "one size fits all" for potential trading situations)
-Source : Data series used for calculation. I recommend hlcc4 or hl2 or hlc3 instead of just "close." This will help to pre process a noisy data series for the rest of the algo.
-Certainty Level : This setting effects how easily the indicator will confirm a new trend and change its bias. " Reactive" does just as it says and will confirm new regimes faster, but can also lead to false signals or "flip flop" in certain types of price action. "Slow" will change biases less frequently or in conjunction with large moves - but this level of certainty requires the sacrifice of reactivity meaning its a bit laggy (but thats ok when you are following a larger trend). "Medium" is as you would expect the middle ground between reactive and slow. Lastly "Adaptive" tends to fall between reactive and medium in its behavior typically, but it will somewhat adjust itself to suit the variability of market conditions.
-Price Envelope :
-----My own personally created price distribution spread (not monte carlo based)
-----Above or below the envelope indicates the presence of a very strong trend. You should not be fading a trend when its in this position!
-----Within the envelope indicates consolidation, but still conforming to the bias.
User Requests :
Of course we also listen to the needs of our members and added these features upon request.
-Added dark mode and light mode themes.
----Dark Mode is for dark/black charts and uses lighter colorations
----Light mode is for light/white charts and uses darker colorations
-More updates to display and color selection options such as background colors and fill colors. Pair Prowler [CR] █ OVERVIEW
Pair Prowler v6 Enhanced is a sophisticated oscillator-based trading system designed for traders seeking high-probability setups with multiple confirmation layers. The indicator combines proprietary signal generation with institutional-grade filters to identify optimal entry and exit points while minimizing false signals.
The system features adaptive zones that dynamically adjust to market conditions, multi-timeframe support/resistance analysis, volume-weighted mean reversion filters, and real-time performance tracking. A comprehensive confluence scoring system evaluates each potential trade across eight technical dimensions, allowing traders to filter for only the highest-quality opportunities.
█ KEY FEATURES
Adaptive Dynamic Zones
Rather than using fixed overbought/oversold levels, the indicator employs statistical methods to calculate adaptive zones that adjust to recent price behavior. These zones automatically widen during high volatility and tighten during consolidation, ensuring signals remain relevant across all market conditions.
VWAP Mean Reversion Filter
This filter uses volume-weighted price analysis to identify when price has moved significantly away from fair value. The system calculates statistical deviation from VWAP and only permits:
- Long entries when price is substantially below VWAP (oversold relative)
- Short entries when price is substantially above VWAP (overbought relative)
Higher Timeframe Support/Resistance Filter
To avoid entries near major reversal zones, the indicator analyzes pivot highs and lows from a user-selected higher timeframe. The system maintains a database of recent support and resistance levels and blocks trades that would occur too close to these critical price levels. This prevents getting stopped out by predictable institutional activity at key levels.
Divergence Detection
The indicator automatically identifies four types of divergences between price and the oscillator.
Risk Entry Signals
For aggressive traders, the indicator provides early warning signals that fire before the main entry triggers. These risk entries offer better entry prices but come with lower probability. They are visually distinct from standard entries and can be toggled on or off.
Safe Exit Zones
In addition to standard exit signals, the system identifies optimal profit-taking zones using statistical analysis and adaptive thresholds. These safe exit zones are highlighted with background coloring to alert traders when positions have reached favorable risk-reward levels.
Performance Statistics Panel
A comprehensive real-time statistics dashboard tracks:
- Total trades executed (long and short separately)
- Win rate percentages (overall, long-only, short-only)
- Profit factor calculation
- Total and average profit/loss per trade
- Largest winning and losing trades
- Maximum consecutive wins and losses
The panel can be positioned in any corner of the chart and updates automatically as trades close. Note that statistics represent theoretical performance based on signal timing and do not account for slippage, commissions, or execution delays.
Comprehensive Alert System
The indicator includes over 20 pre-configured alert types
█ HOW TO USE
Initial Setup
1 — Select your preferred base strategy from the Signal Settings group. Strategy 1 is recommended for most traders as it provides a balanced approach suitable for various market conditions.
2 — Configure the VWAP filter threshold based on your trading style:
Lower thresholds (1.0–1.5) for more frequent entries
Higher thresholds (2.0+) for fewer but more extreme reversals
3 — Set the HTF S/R filter timeframe to approximately 4–6 times your chart timeframe. For example, use 4H pivots when trading on 1H charts.
Reading Signals
Entry signals appear as triangles at the oscillator level:
- Green upward triangles indicate long entries
- Red downward triangles indicate short entries
- Small circles mark early risk entries
Exit signals appear as opposite-colored triangles. Background shading indicates special conditions like safe exit zones or averaging opportunities.
Interpreting Statistics
Use the performance panel to gauge strategy effectiveness:
- Win rates above 50% indicate positive edge
- Profit factor above 1.5 suggests robust performance
- Review max consecutive losses for position sizing guidance
Remember that past theoretical performance does not guarantee future results.
█ NOTES
Timeframe Considerations
This indicator works on all timeframes but performs optimally on 15-minute to 4-hour charts. Very low timeframes (1m–5m) may produce excessive signals, while daily and weekly charts may produce insufficient signals for active trading.
Market Conditions
The adaptive nature of the indicator allows it to function in both trending and ranging markets. However, extremely choppy or low-liquidity conditions may reduce signal quality. The confluence scoring system helps filter these periods automatically.
VWAP Behavior
VWAP resets at session boundaries for traditional markets (stocks) but runs continuously for 24-hour markets (crypto, forex). The z-score filter accounts for this difference automatically.
HTF Pivot Lag
Higher timeframe pivots require confirmation bars before being identified, introducing slight lag. Pivots are detected retrospectively once the full pattern completes on the selected timeframe.
Performance Tracking Limitations
The statistics panel tracks theoretical entry at close of signal bar and exit at close of exit bar. Actual trading results will differ due to:
- Slippage and spread costs
- Commission and fees
- Execution timing and delays
- Partial fills or rejections
- Overnight holding costs
Use the statistics as a comparative tool for optimization rather than a profit predictor.
Filter Interactions
All filters work sequentially. A signal must pass the VWAP filter, then the S/R filter. If any filter rejects the signal, it will not appear on the chart. This hierarchical approach ensures only fully validated setups generate alerts.
Optimization Guidelines
If receiving too many signals, tighten filter thresholds. If receiving too few signals, relax filters. Monitor the statistics panel over at least 50 trades before making significant parameter adjustments.
Enhanced Sigma by Cryptorhythms [CR] - Advanced Enhanced Sigma - Advanced Volatility-Normalized Returns Analysis
The Enhanced Sigma indicator measures volatility-adjusted price returns to identify statistical extremes, regime changes, and mean reversion opportunities. By normalizing returns against their standard deviation, the indicator reveals when markets are experiencing unusual moves relative to recent volatility—highlighting potential exhaustion points, capitulation events, and statistical anomalies.
█ OVERVIEW
Sigma (σ) represents how many standard deviations current returns deviate from normal behavior. Readings beyond ±2.0 indicate statistically unusual moves, while extreme readings beyond ±3.0 occur less than 1% of the time under normal distribution. This version adds multi-layered analysis including regime detection, multi-timeframe confirmation, and adaptive thresholds.
█ KEY FEATURES
Return Calculation Methods
The indicator supports multiple return calculation approaches:
- Simple Returns — Standard percentage change calculation
- Log Returns — Logarithmic returns for better statistical properties
- Geometric Returns — Square root based calculation
- Percentage Returns — Scaled percentage format
Volume Weighting
Optional volume weighting emphasizes high-volume moves while dampening low-volume noise. When enabled, returns are weighted by normalized volume to give more significance to moves occurring on institutional participation.
Threshold Methods
Two threshold calculation approaches:
- Fixed Thresholds — Manual static levels
- Percentile-Based — Adaptive thresholds calculated from historical distribution
Percentile-based thresholds automatically adjust to changing volatility regimes over configurable lookback periods.
Statistical Significance Testing
Built-in t-test functionality determines whether current sigma readings are statistically significant or merely random noise. Configurable confidence levels (80-99.9%) filter out insignificant moves. Non-significant readings are visually dimmed.
Multi-Timeframe Analysis
Analyzes sigma across multiple timeframes simultaneously. Confluence signals trigger when all timeframes (current, 3x, 5x) align at extremes—indicating stronger conviction and reduced false signals. MTF sigma values are plotted as reference lines.
Regime Detection
Automatically classifies current volatility environment into four regimes:
- Low Volatility — Market in compression
- Normal — Standard volatility conditions
- High Volatility — Elevated movement
- Extreme — Unusual volatility expansion
Regime classification uses percentile ranking and statistical deviation analysis.
Adaptive Threshold System
Three methods for automatic threshold adjustment:
- ATR-Based — Adjusts based on Average True Range ratio
- Volatility Regime — Tightens in low volatility, widens in high volatility
- Range Expansion — Responds to recent sigma range changes
When enabled, thresholds dynamically scale with market conditions to maintain consistent sensitivity.
Cluster Analysis
Detects and scores clusters of threshold breaches within rolling windows. High cluster scores can indicate capitulation or exhaustion phases. Visual labels "C" show active clusters.
Mean Reversion Signals
Generates entry and exit signals based on extreme sigma readings returning to mean:
- Long Entry — Triggered on oversold extremes
- Short Entry — Triggered on overbought extremes
- Exit Signals — When sigma normalizes or time-based exit reached (marked as gray "X")
Optional statistical significance filter ensures only high-probability setups generate signals. Position tracking displays unrealized P&L.
Distribution Histogram
Displays sigma value distribution as a horizontal histogram showing Point of Control (POC)—the most frequently occurring sigma level. Configurable bin size and lookback period.
Statistics Dashboard
Real-time table displaying:
- Current sigma value and percentile rank
- Statistical measures (mean, std dev, skewness, kurtosis)
- Volatility regime classification
- Extreme event frequency
- Bars since last extreme
- Position status and P&L (when mean reversion enabled)
█ VISUAL ELEMENTS
Threshold Lines
- Aqua/Cyan lines — Positive (high) thresholds
- Fuchsia/Magenta lines — Negative (low) thresholds
- Solid lines — Short-term dynamic thresholds
- Circles — Long-term dynamic thresholds
- Crosses — Percentile-based static thresholds (when enabled)
Sigma Histogram
Primary histogram uses momentum-based coloring:
- Purple shades — Negative sigma (declining)
- Cyan shades — Positive sigma (advancing)
- Darker shades indicate weakening momentum
- Brighter shades indicate strengthening momentum
Statistically significant threshold breaches are highlighted with intensified colors.
Shape Markers
- Small triangles — Statistically significant threshold breaches
- Diamonds — Multi-timeframe confluence signals
- Large triangles with text — Mean reversion entry signals (LONG/SHORT)
- X markers — Mean reversion exit signals
- Labels — Cluster detection alerts
█ ALERTS
The indicator includes comprehensive alert conditions. Use confirm on bar close if repainting is enabled.
█ HOW TO USE
Identifying Extremes
Sigma readings beyond ±2.0 indicate unusual moves. Look for:
- Threshold breaches with statistical significance markers (triangles)
- Multi-timeframe confluence (diamonds) for stronger signals
- Cluster formation indicating potential exhaustion
Regime-Aware Trading
Use regime detection to adjust expectations:
- In Low Volatility regimes, smaller sigma moves may be significant
- In Extreme regimes, higher thresholds prevent overtrading
Mean Reversion Strategy
Enable mean reversion signals for systematic entries:
- LONG signals appear after statistically significant oversold extremes
- SHORT signals appear after statistically significant overbought extremes
- Exit signals trigger on return to mean or time-based stops
Distribution Analysis
Use the histogram to identify:
- POC level — Where sigma spends most time (equilibrium)
- Current position relative to distribution