
Company: Hyundai Mobis
Ticker: 012330
Exchange: Korea Exchange (KRX)
Index: KOSPI 100
Region: South Korea
Introduction:
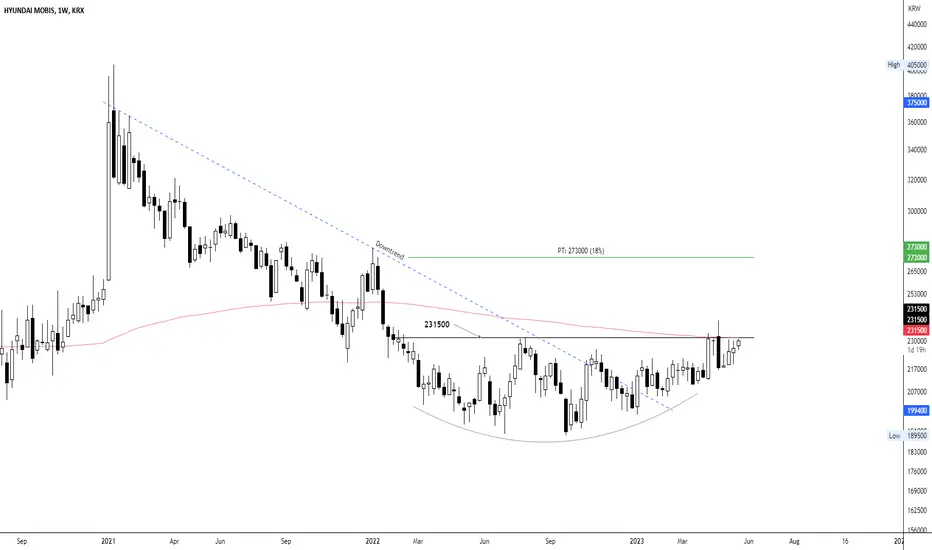
Greetings to all. In today's technical analysis, we're focusing on Hyundai Mobis, a constituent of the KOSPI 100. The company's weekly chart reveals a compelling potential long position setup, featuring a clear rounding bottom pattern.
Rounding Bottom Pattern:
The rounding bottom pattern is a long-term reversal pattern that is typically bullish. It signifies a gradual transition from a bearish trend to a bullish one.
Analysis:
Hyundai Mobis had been in a clear downward trend, as evidenced by the blue diagonal resistance line. A beautiful rounding bottom pattern has since formed during the consolidation phase. The horizontal neckline of this pattern is at 231500 KRW, coinciding almost exactly with the position of the EMA 200, underscoring the significance of this resistance level.
Should we witness a breakout above this defined zone, it could signal an opportune moment to initiate a long position. The price target, assuming a successful breakout, would be set at 273000 KRW, corresponding to a potential price increase of approximately 18%.
Please note, it's crucial to wait for a weekly candle to close above this resistance before entering this position. At present, Hyundai Mobis should be considered a high-priority watchlist candidate.
Conclusion:
The weekly chart of Hyundai Mobis presents an appealing scenario, with a rounding bottom pattern potentially indicating a bullish reversal. A breakout above the well-defined resistance could provide an opportunity for a long position.
As always, please bear in mind that this analysis does not constitute financial advice. Conduct your own research and implement risk management strategies when investing.
If you found this analysis insightful, please like, share, and follow for more updates. Happy trading!
Best regards,
Karim Subhieh

KSC
관련 발행물
면책사항
해당 정보와 게시물은 금융, 투자, 트레이딩 또는 기타 유형의 조언이나 권장 사항으로 간주되지 않으며, 트레이딩뷰에서 제공하거나 보증하는 것이 아닙니다. 자세한 내용은 이용 약관을 참조하세요.
면책사항
해당 정보와 게시물은 금융, 투자, 트레이딩 또는 기타 유형의 조언이나 권장 사항으로 간주되지 않으며, 트레이딩뷰에서 제공하거나 보증하는 것이 아닙니다. 자세한 내용은 이용 약관을 참조하세요.