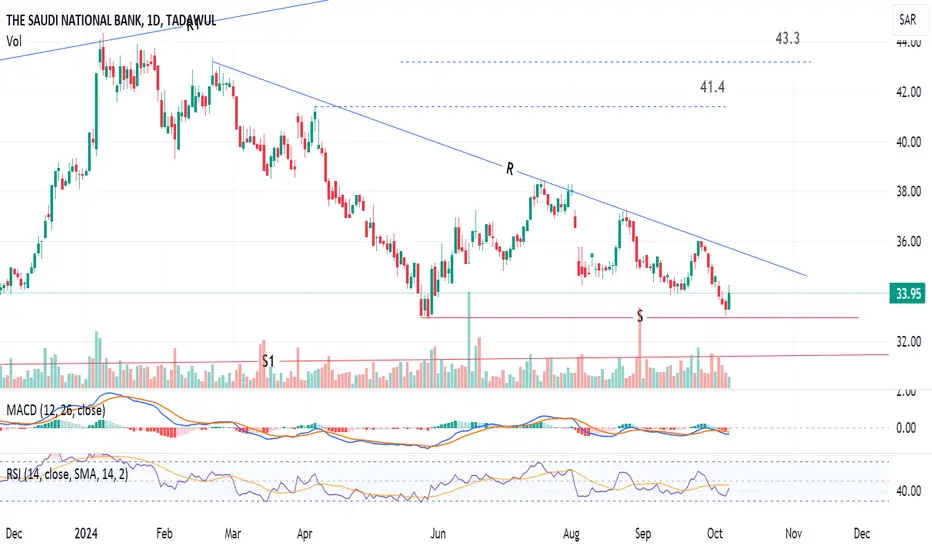
Daily chart, the stock  1180 is trading in a descending triangle, with upper line R and lower S
It is seen as a short term trading opportunity between S and R.
However, the price should close 2 days above line R to activate the target 41.4 then 43.3
A stop loss should be considered below line R (32.9).
Be careful: Below support line S, the price can fall to next support line S1 at around 31.4
1180 is trading in a descending triangle, with upper line R and lower SIt is seen as a short term trading opportunity between S and R.
However, the price should close 2 days above line R to activate the target 41.4 then 43.3
A stop loss should be considered below line R (32.9).
Be careful: Below support line S, the price can fall to next support line S1 at around 31.4

면책사항
해당 정보와 게시물은 금융, 투자, 트레이딩 또는 기타 유형의 조언이나 권장 사항으로 간주되지 않으며, 트레이딩뷰에서 제공하거나 보증하는 것이 아닙니다. 자세한 내용은 이용 약관을 참조하세요.
면책사항
해당 정보와 게시물은 금융, 투자, 트레이딩 또는 기타 유형의 조언이나 권장 사항으로 간주되지 않으며, 트레이딩뷰에서 제공하거나 보증하는 것이 아닙니다. 자세한 내용은 이용 약관을 참조하세요.