
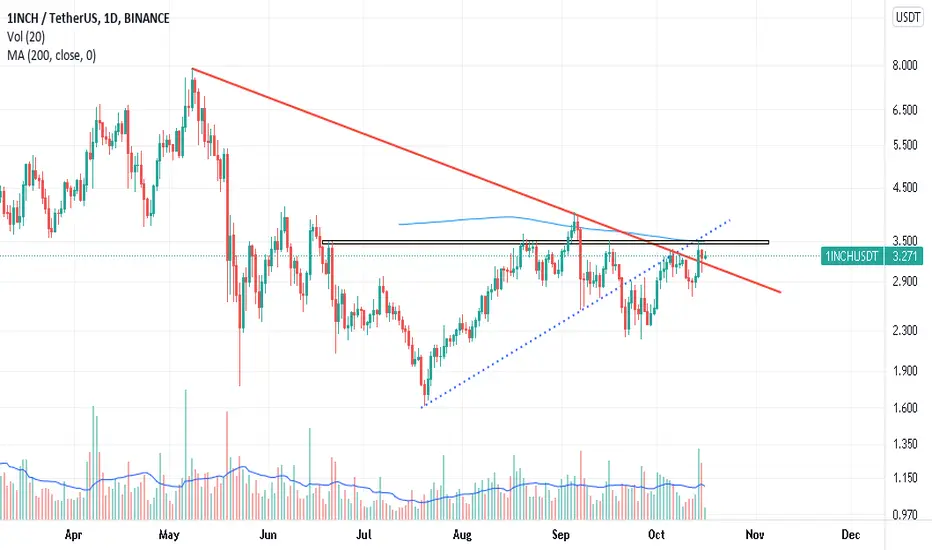
As you can see, according to the chart above, this digital currency after breaking its long-term dynamic resistance (red line), to the intersection of short-term dynamic resistance (blue dashed line that can be seen in the chart) and static resistance (orange area) and It also hit its $ 200 moving average resistance at $ 3.5 and failed to break it.
The recent short-term correction of this currency can be considered as a kind of pullback to the broken resistance and the absorption of momentum necessary to overcome the hard resistance of $ 3.5. A good entry point for the resistance is $ 3.5 and its high stabilization.
The recent short-term correction of this currency can be considered as a kind of pullback to the broken resistance and the absorption of momentum necessary to overcome the hard resistance of $ 3.5. A good entry point for the resistance is $ 3.5 and its high stabilization.

면책사항
해당 정보와 게시물은 금융, 투자, 트레이딩 또는 기타 유형의 조언이나 권장 사항으로 간주되지 않으며, 트레이딩뷰에서 제공하거나 보증하는 것이 아닙니다. 자세한 내용은 이용 약관을 참조하세요.
면책사항
해당 정보와 게시물은 금융, 투자, 트레이딩 또는 기타 유형의 조언이나 권장 사항으로 간주되지 않으며, 트레이딩뷰에서 제공하거나 보증하는 것이 아닙니다. 자세한 내용은 이용 약관을 참조하세요.