
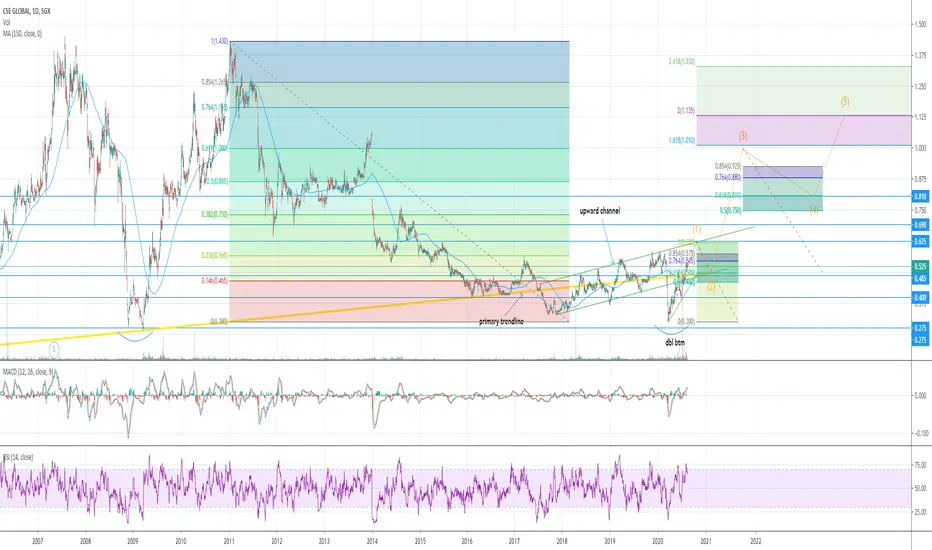
1. Trend Analysis
Downtrend
2. Indicator analysis
Weekly 150SMA
Increasing volume
overrated MACD ( Bearish)
Overbought RSI w low vol (bearish)
3. Trendline Analysis
Due to closure below primary trendline(yellow)
,buyers are afraid of entering as a major
drop may happen.
4..S&R Analysis
Support comes at Primary trendline (in yellow)
Resistance at upper channel line( in green)
5. Breakout Analysis
Elliot wave Charting with key fib in place and
predicted movement in orange
6. Pattern analysis
Recovery or reversal from double btm
Trading Plan (Impulsive Elliot wave)
Entry @ around 0.5 when it comes back from 0.625
Stop loss: weekly close below 0.4
TP(1):0.99 ~ 1
TP(2): 1.125
Pls DYODD
Downtrend
2. Indicator analysis
Weekly 150SMA
Increasing volume
overrated MACD ( Bearish)
Overbought RSI w low vol (bearish)
3. Trendline Analysis
Due to closure below primary trendline(yellow)
,buyers are afraid of entering as a major
drop may happen.
4..S&R Analysis
Support comes at Primary trendline (in yellow)
Resistance at upper channel line( in green)
5. Breakout Analysis
Elliot wave Charting with key fib in place and
predicted movement in orange
6. Pattern analysis
Recovery or reversal from double btm
Trading Plan (Impulsive Elliot wave)
Entry @ around 0.5 when it comes back from 0.625
Stop loss: weekly close below 0.4
TP(1):0.99 ~ 1
TP(2): 1.125
Pls DYODD

면책사항
해당 정보와 게시물은 금융, 투자, 트레이딩 또는 기타 유형의 조언이나 권장 사항으로 간주되지 않으며, 트레이딩뷰에서 제공하거나 보증하는 것이 아닙니다. 자세한 내용은 이용 약관을 참조하세요.
면책사항
해당 정보와 게시물은 금융, 투자, 트레이딩 또는 기타 유형의 조언이나 권장 사항으로 간주되지 않으며, 트레이딩뷰에서 제공하거나 보증하는 것이 아닙니다. 자세한 내용은 이용 약관을 참조하세요.