
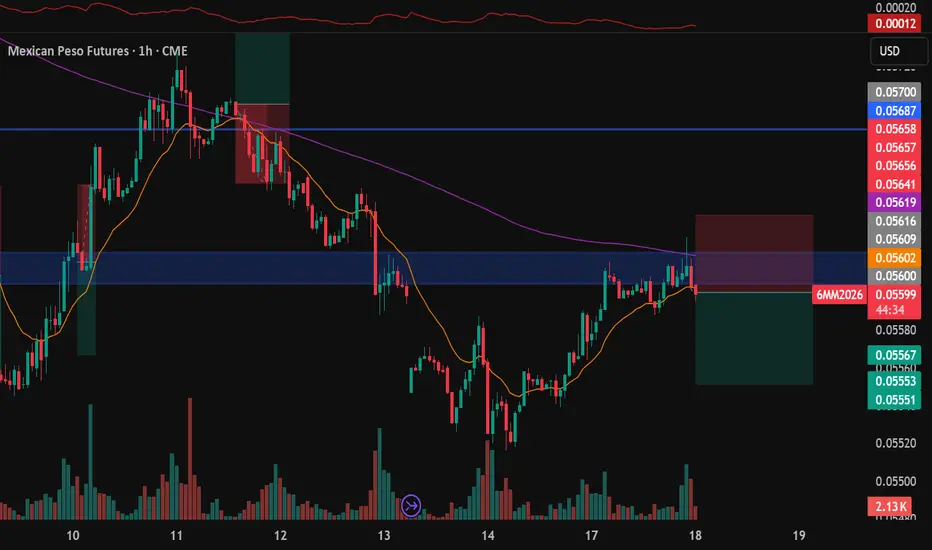
Price came back to an area of resistance that has been tested multiple times on the 4hr chart. Dropping to the 1hr chart to look for entries, there's a double top which is a bearish reversal pattern forming.On the second top, there's a hammer candle followed by a bearish engulfing candle that marks our entry. The volume on the hammer candle is very heavily bullish but the long wick on the hammer candle suggest that the bears has strong selling pressure and is pushing the price lower. Stops is 1 atr above the highs and aim for a 1.2RR although we can close some of the position first and let the trade ride to the bottom.

면책사항
해당 정보와 게시물은 금융, 투자, 트레이딩 또는 기타 유형의 조언이나 권장 사항으로 간주되지 않으며, 트레이딩뷰에서 제공하거나 보증하는 것이 아닙니다. 자세한 내용은 이용 약관을 참조하세요.
면책사항
해당 정보와 게시물은 금융, 투자, 트레이딩 또는 기타 유형의 조언이나 권장 사항으로 간주되지 않으며, 트레이딩뷰에서 제공하거나 보증하는 것이 아닙니다. 자세한 내용은 이용 약관을 참조하세요.