
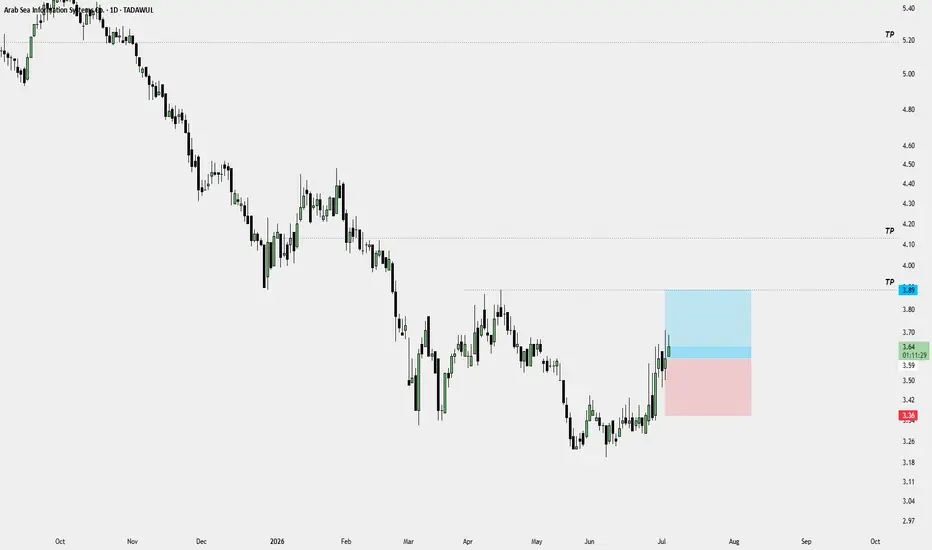
Arab Sea Information Systems Co. — Daily Bullish Continuation Idea | July 05, 2026
Symbol: Arab Sea Information Systems Co. — Tadawul
Timeframe: Daily
Chart Date: July 05, 2026
Arab Sea Information Systems Co. is showing a clean bullish recovery after a long bearish decline. Price has formed a base near the lower area and then moved up with strong bullish displacement, which shows that buyers are starting to take control on the daily timeframe.
Now price is holding near the current reaction zone, and the chart is showing a possible bullish continuation setup. The risk area is clearly defined below the current structure, while the upside has multiple marked TP levels.
My main idea is simple:
if price holds above the recent bullish range and does not break aggressively below the setup area, the next draw can be the first marked TP. After that, if momentum remains strong, the higher TP levels can come into focus.
I am not interested in chasing blindly. I want to see price respect the current range, hold above the recent support, and continue with clean bullish candles.
For confirmation, I want to see:
Price holds above the current bullish range
No strong breakdown below the risk zone
Daily candles continue showing bullish strength
Clean continuation toward the first TP
Higher targets only if momentum remains strong
This setup looks interesting because price has already shifted from weakness into a stronger recovery phase. Now the key is whether buyers can defend this daily structure.
Patience pays. Wait for confirmation, not emotions.
Symbol: Arab Sea Information Systems Co. — Tadawul
Timeframe: Daily
Chart Date: July 05, 2026
Arab Sea Information Systems Co. is showing a clean bullish recovery after a long bearish decline. Price has formed a base near the lower area and then moved up with strong bullish displacement, which shows that buyers are starting to take control on the daily timeframe.
Now price is holding near the current reaction zone, and the chart is showing a possible bullish continuation setup. The risk area is clearly defined below the current structure, while the upside has multiple marked TP levels.
My main idea is simple:
if price holds above the recent bullish range and does not break aggressively below the setup area, the next draw can be the first marked TP. After that, if momentum remains strong, the higher TP levels can come into focus.
I am not interested in chasing blindly. I want to see price respect the current range, hold above the recent support, and continue with clean bullish candles.
For confirmation, I want to see:
Price holds above the current bullish range
No strong breakdown below the risk zone
Daily candles continue showing bullish strength
Clean continuation toward the first TP
Higher targets only if momentum remains strong
This setup looks interesting because price has already shifted from weakness into a stronger recovery phase. Now the key is whether buyers can defend this daily structure.
Patience pays. Wait for confirmation, not emotions.

I am an SMC & ICT Master, specializing in Market Structure, Liquidity, and Order Flow. With a razor-sharp focus on precision trading, I navigate the markets with strategy and discipline—turning probabilities into profitability!
면책사항
해당 정보와 게시물은 금융, 투자, 트레이딩 또는 기타 유형의 조언이나 권장 사항으로 간주되지 않으며, 트레이딩뷰에서 제공하거나 보증하는 것이 아닙니다. 자세한 내용은 이용 약관을 참조하세요.
I am an SMC & ICT Master, specializing in Market Structure, Liquidity, and Order Flow. With a razor-sharp focus on precision trading, I navigate the markets with strategy and discipline—turning probabilities into profitability!
면책사항
해당 정보와 게시물은 금융, 투자, 트레이딩 또는 기타 유형의 조언이나 권장 사항으로 간주되지 않으며, 트레이딩뷰에서 제공하거나 보증하는 것이 아닙니다. 자세한 내용은 이용 약관을 참조하세요.