
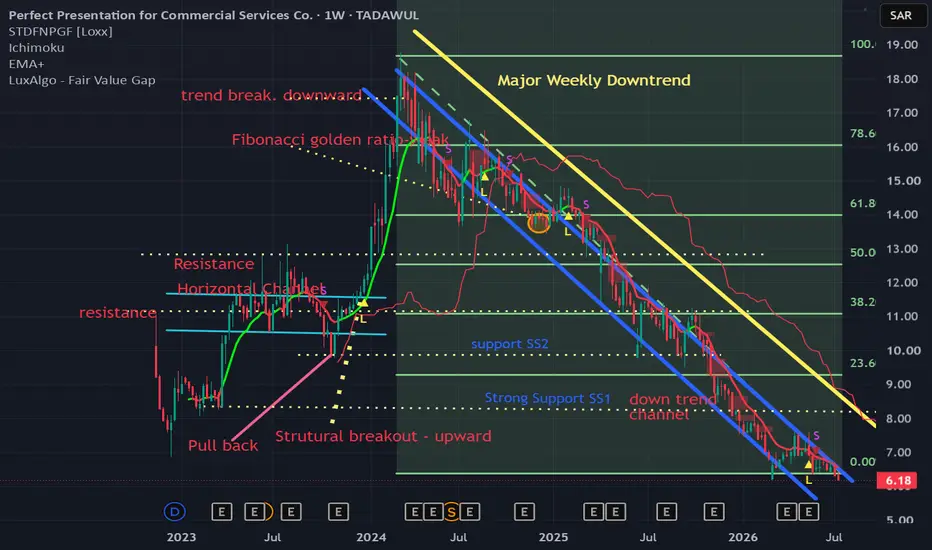
share your thought and identify the errors in chart. it is observed that 7204 is in down trend for long and it is obvious. it will clear give indication to learners who wanted to you different indicators, and trying by the own to identify the trends and trying to identify Fibonacci golden ratio. this might help you.
액티브 트레이드
Please share your thoughts and identify any errors in the chart. It can be clearly observed that 7204 has been in a long-term downtrend. This is quite evident and can provide a valuable learning opportunity for traders and learners who are using different technical indicators to identify trends on their own. Additionally, those attempting to apply Fibonacci retracement levels and identify the Golden Ratio may find this chart helpful. Studying such examples can improve trend analysis skills and enhance understanding of technical analysis concepts.
면책사항
해당 정보와 게시물은 금융, 투자, 트레이딩 또는 기타 유형의 조언이나 권장 사항으로 간주되지 않으며, 트레이딩뷰에서 제공하거나 보증하는 것이 아닙니다. 자세한 내용은 이용 약관을 참조하세요.
면책사항
해당 정보와 게시물은 금융, 투자, 트레이딩 또는 기타 유형의 조언이나 권장 사항으로 간주되지 않으며, 트레이딩뷰에서 제공하거나 보증하는 것이 아닙니다. 자세한 내용은 이용 약관을 참조하세요.