
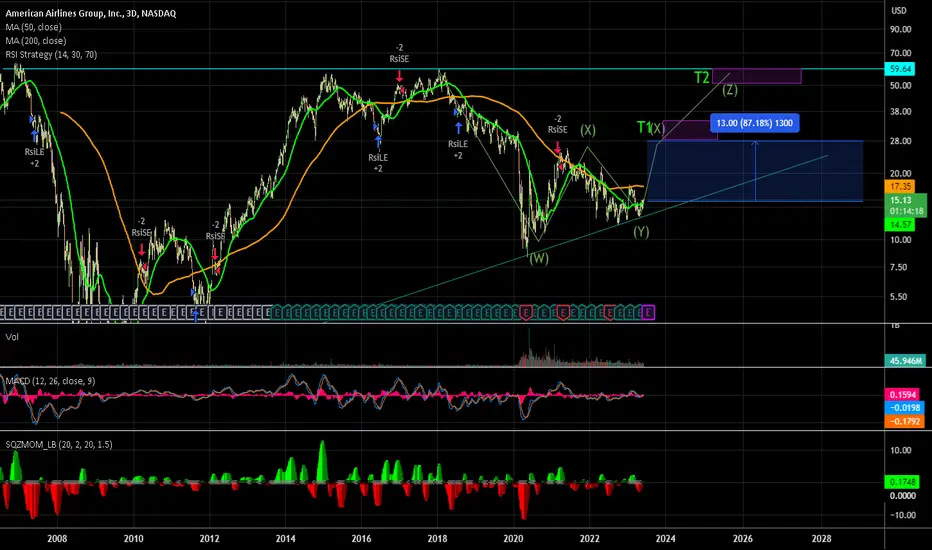
Rev Growth YoY and FWD are 50 and 23% respectively and 307 and 167% above the sector respectively while PE GAAP TTM and FWD are 71 and 65% below sector! This implies a huge discount in growth.
Gross Profit does lag behind the sector by about 12%, but the valuation combined with the outsized growth substantially off-sets this disparity.
On a technical note, there is an intermediary "W" pattern. Confirmation of this pattern would be realized once the SP closes above the midpoint peak of @25.75 along w/ substantial volume, 3 day rule, etc. Pattern and targets are also correlated with Fibonacci retracement levels and Fib Time series.
Gross Profit does lag behind the sector by about 12%, but the valuation combined with the outsized growth substantially off-sets this disparity.
On a technical note, there is an intermediary "W" pattern. Confirmation of this pattern would be realized once the SP closes above the midpoint peak of @25.75 along w/ substantial volume, 3 day rule, etc. Pattern and targets are also correlated with Fibonacci retracement levels and Fib Time series.

면책사항
해당 정보와 게시물은 금융, 투자, 트레이딩 또는 기타 유형의 조언이나 권장 사항으로 간주되지 않으며, 트레이딩뷰에서 제공하거나 보증하는 것이 아닙니다. 자세한 내용은 이용 약관을 참조하세요.
면책사항
해당 정보와 게시물은 금융, 투자, 트레이딩 또는 기타 유형의 조언이나 권장 사항으로 간주되지 않으며, 트레이딩뷰에서 제공하거나 보증하는 것이 아닙니다. 자세한 내용은 이용 약관을 참조하세요.