
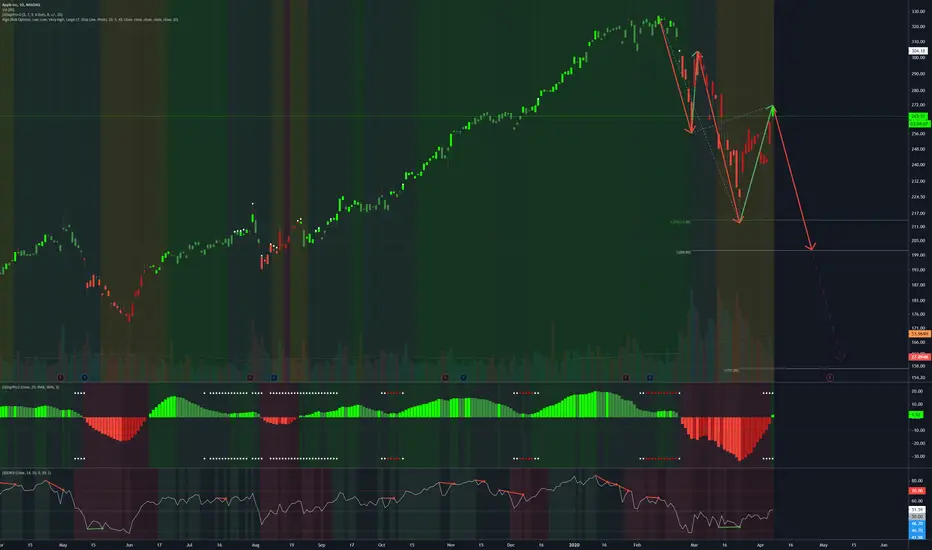
I am going to start sharing a lot more of my chart analysis with the community. This is a potential scenario in the event the market turns for lower lows. A leading diagonal in EW with wave 5 showing equality with wave 1 at 200. Also included the "extended 5th wave" scenario since wave 3 was only 1.272 of wave 1. I don't think that is likely though, but if the market turns back down I'd be watching for that 200 level on AAPL for sure.

면책사항
해당 정보와 게시물은 금융, 투자, 트레이딩 또는 기타 유형의 조언이나 권장 사항으로 간주되지 않으며, 트레이딩뷰에서 제공하거나 보증하는 것이 아닙니다. 자세한 내용은 이용 약관을 참조하세요.
면책사항
해당 정보와 게시물은 금융, 투자, 트레이딩 또는 기타 유형의 조언이나 권장 사항으로 간주되지 않으며, 트레이딩뷰에서 제공하거나 보증하는 것이 아닙니다. 자세한 내용은 이용 약관을 참조하세요.