
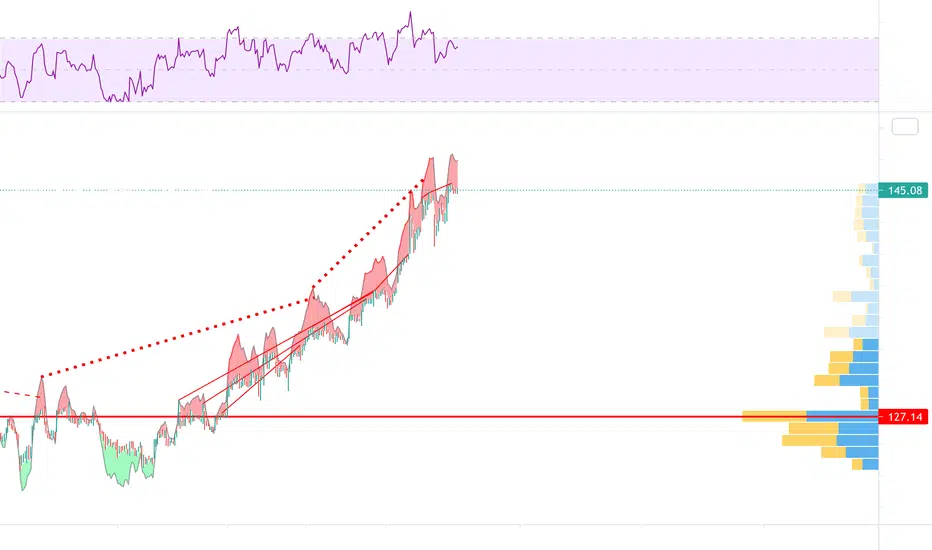
I am a huge fan of Apple and their business model, but this is technical analysis and the "red" flags are screaming that it is time for a sharp correction.
Indicators:
I. Red trend lines signaling future decline ( trend lines are from the Knoxville Divergence indicator and help foresee growing divergence often times ahead of MACD and traditional sell signals
II. High RSi shows that Apple is extremely overbought
III. Visible range shows the prime trading activity price is 127.14
IV. Divergence+ shows a red cloud above the most recent candles indicating high levels of bearish divergence
Feedback:
Let me know your thoughts in the comments below, this analysis has been used previously and is extremely accurate.
Previous analysis linked below
Indicators:
I. Red trend lines signaling future decline ( trend lines are from the Knoxville Divergence indicator and help foresee growing divergence often times ahead of MACD and traditional sell signals
II. High RSi shows that Apple is extremely overbought
III. Visible range shows the prime trading activity price is 127.14
IV. Divergence+ shows a red cloud above the most recent candles indicating high levels of bearish divergence
Feedback:
Let me know your thoughts in the comments below, this analysis has been used previously and is extremely accurate.
Previous analysis linked below
노트
Please view my latest analysis that also supports this claim that Apple will have a higher low before hitting new highs into earnings노트
Maybe I'll use the profits from this $139 put & then buy calls after. This is a too good to be true scenario but if it happens, I will be sharing the joy with everyone in the form of cheers. :)

관련 발행물
면책사항
해당 정보와 게시물은 금융, 투자, 트레이딩 또는 기타 유형의 조언이나 권장 사항으로 간주되지 않으며, 트레이딩뷰에서 제공하거나 보증하는 것이 아닙니다. 자세한 내용은 이용 약관을 참조하세요.
관련 발행물
면책사항
해당 정보와 게시물은 금융, 투자, 트레이딩 또는 기타 유형의 조언이나 권장 사항으로 간주되지 않으며, 트레이딩뷰에서 제공하거나 보증하는 것이 아닙니다. 자세한 내용은 이용 약관을 참조하세요.