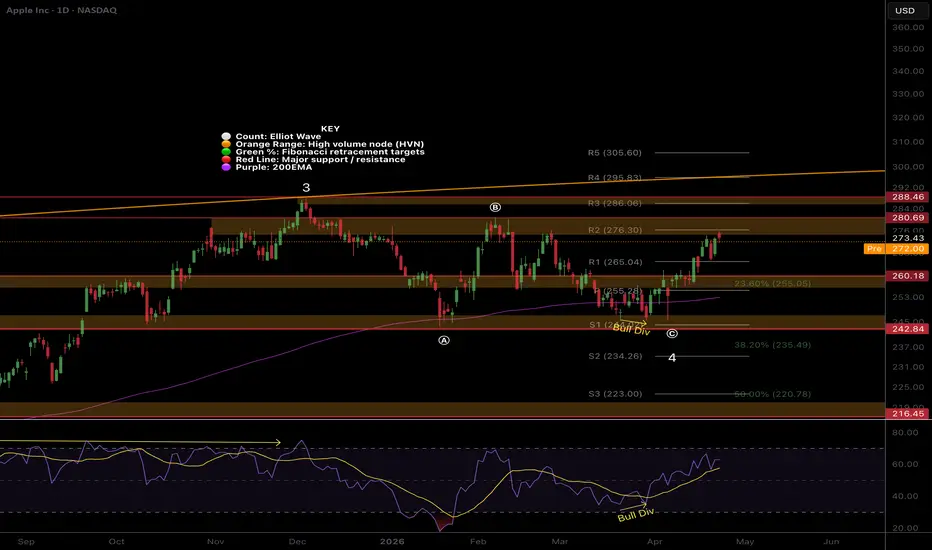
 AAPL tested the rising daily 200EMA twice and recovered the daily pivot, showing bulls in control locally. The structure is ambiguous as there is only 1 higher-high and lower-low so far. The triangle structure could also be forming a flat correction, which would be expected to have a push slightly below wave (a), completing wave 4, before pressing to new ATHs. Price is in a major resistance HVN, which is expected to be tested 3+ times before breaking.
📈 Daily RSI printed a bullish divergence, and price reacted strongly
👉 Triangle Analysis is invalidated if price breaks above wave (B), suggesting ATH incoming. While a pop below © and (A) keeps the bearish trend alive with a downside target of $238 at the 0.382 Fibs.
Safe trading

🎓 Behavioural Economist (PhD)
📈 Trader / Investor 15 years
👑 Unlock my trading plans: tradingblueprints.substack.com
🏆 Market Psychologist Newsletter: marketpsychologist.substack.com
📈 Trader / Investor 15 years
👑 Unlock my trading plans: tradingblueprints.substack.com
🏆 Market Psychologist Newsletter: marketpsychologist.substack.com
관련 발행물
면책사항
해당 정보와 게시물은 금융, 투자, 트레이딩 또는 기타 유형의 조언이나 권장 사항으로 간주되지 않으며, 트레이딩뷰에서 제공하거나 보증하는 것이 아닙니다. 자세한 내용은 이용 약관을 참조하세요.
🎓 Behavioural Economist (PhD)
📈 Trader / Investor 15 years
👑 Unlock my trading plans: tradingblueprints.substack.com
🏆 Market Psychologist Newsletter: marketpsychologist.substack.com
📈 Trader / Investor 15 years
👑 Unlock my trading plans: tradingblueprints.substack.com
🏆 Market Psychologist Newsletter: marketpsychologist.substack.com
관련 발행물
면책사항
해당 정보와 게시물은 금융, 투자, 트레이딩 또는 기타 유형의 조언이나 권장 사항으로 간주되지 않으며, 트레이딩뷰에서 제공하거나 보증하는 것이 아닙니다. 자세한 내용은 이용 약관을 참조하세요.