
Hi!
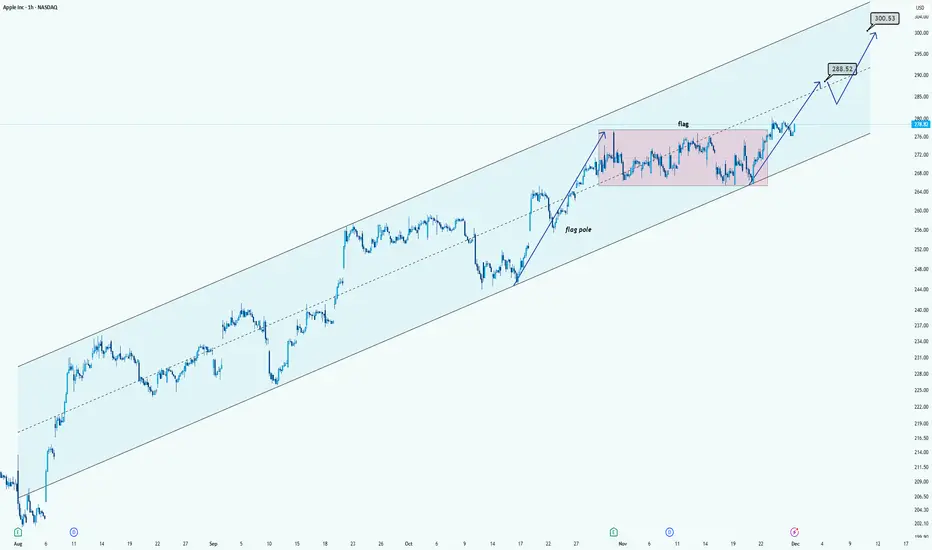
AAPL is trading inside a clean long-term ascending channel, showing a strong uptrend. Recently, the price formed a bullish flag (pink zone) after a sharp move up. The breakout above the flag signals continuation of the trend.
The chart projects two key upside levels:
As long as price stays above the flag range and respects the channel, the bullish structure remains intact.
AAPL is trading inside a clean long-term ascending channel, showing a strong uptrend. Recently, the price formed a bullish flag (pink zone) after a sharp move up. The breakout above the flag signals continuation of the trend.
The chart projects two key upside levels:
$288.52 as the first target (flag breakout objective / mid-channel resistance)
$300.53 as the second target (upper channel boundary + psychological level)
As long as price stays above the flag range and respects the channel, the bullish structure remains intact.
거래청산: 타겟 닿음
the first target has been touched
🟢 Telegram channel: t.me/melikatrader94
🔴 Forex channel: t.me/melikatrader94GoldForex
🟢 ADX & DFM channel: t.me/ADXandDFM
🔴 Tiktok: tiktok.com/@melikatrader94?is_from_webapp=1&sender_device=pc
🔴 Forex channel: t.me/melikatrader94GoldForex
🟢 ADX & DFM channel: t.me/ADXandDFM
🔴 Tiktok: tiktok.com/@melikatrader94?is_from_webapp=1&sender_device=pc
관련 발행물
면책사항
해당 정보와 게시물은 금융, 투자, 트레이딩 또는 기타 유형의 조언이나 권장 사항으로 간주되지 않으며, 트레이딩뷰에서 제공하거나 보증하는 것이 아닙니다. 자세한 내용은 이용 약관을 참조하세요.