
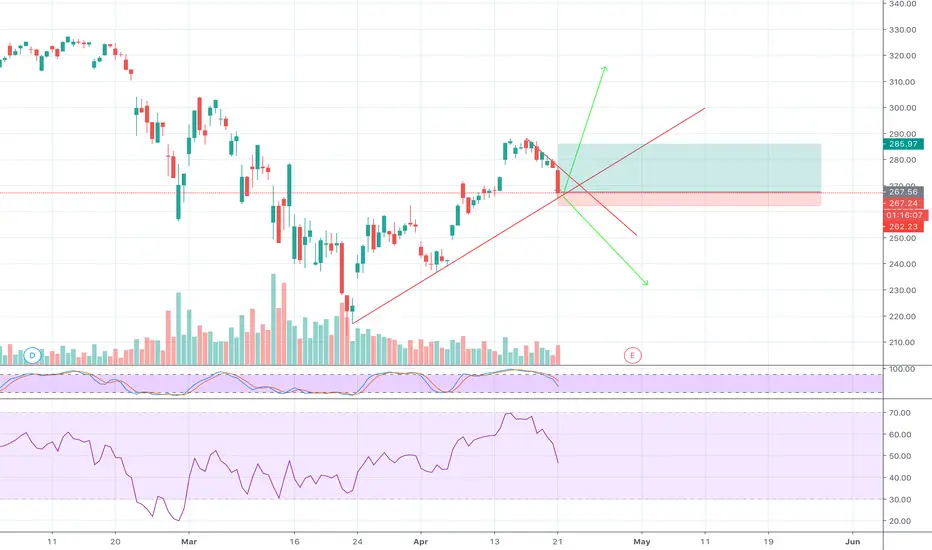
As we can see a symmetrical triangle there are more chance of upward breakout however if there is a breakout downward the tp and sl would be opposite as shown in the diagram the support has been tested twice and seem to be a strong support so a buy can be made if the price holds however if the price breaks so we should wait for the confirmation by letting the candle to close below the support trend line same goes for a upside break.
TP and SLare shown in the diagram
Do always use trailing profit
If you like my analysis do like and comment below whether you agree or disagree from my analysis and do follow me. As I regularly post the prediction on all major forex currency pairs,gold,bitcoin,and stocks like Tesla
Note this is not a trading advice and I am wrong 100%
TP and SLare shown in the diagram
Do always use trailing profit
If you like my analysis do like and comment below whether you agree or disagree from my analysis and do follow me. As I regularly post the prediction on all major forex currency pairs,gold,bitcoin,and stocks like Tesla
Note this is not a trading advice and I am wrong 100%

관련 발행물
면책사항
해당 정보와 게시물은 금융, 투자, 트레이딩 또는 기타 유형의 조언이나 권장 사항으로 간주되지 않으며, 트레이딩뷰에서 제공하거나 보증하는 것이 아닙니다. 자세한 내용은 이용 약관을 참조하세요.
관련 발행물
면책사항
해당 정보와 게시물은 금융, 투자, 트레이딩 또는 기타 유형의 조언이나 권장 사항으로 간주되지 않으며, 트레이딩뷰에서 제공하거나 보증하는 것이 아닙니다. 자세한 내용은 이용 약관을 참조하세요.