
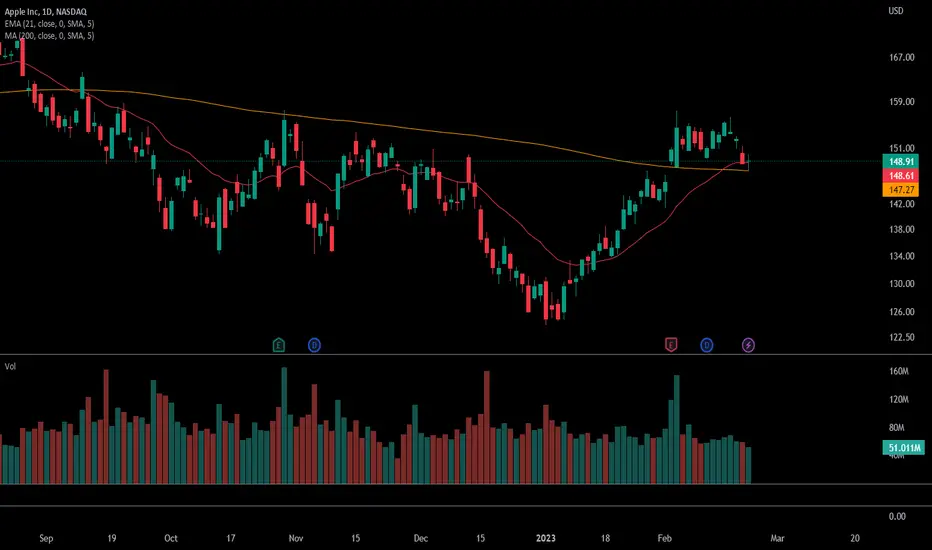
Yesterday's choppiness & market direction indecision in the tech sector can be summarized by this DOJI candle on the APPLE daily chart formed off the 200 day MA and closed just above the 21 EMA. Possible reversal to retest and break $150: LONG. Level of support of 146.75 area, break below: SHORT

면책사항
해당 정보와 게시물은 금융, 투자, 트레이딩 또는 기타 유형의 조언이나 권장 사항으로 간주되지 않으며, 트레이딩뷰에서 제공하거나 보증하는 것이 아닙니다. 자세한 내용은 이용 약관을 참조하세요.
면책사항
해당 정보와 게시물은 금융, 투자, 트레이딩 또는 기타 유형의 조언이나 권장 사항으로 간주되지 않으며, 트레이딩뷰에서 제공하거나 보증하는 것이 아닙니다. 자세한 내용은 이용 약관을 참조하세요.