
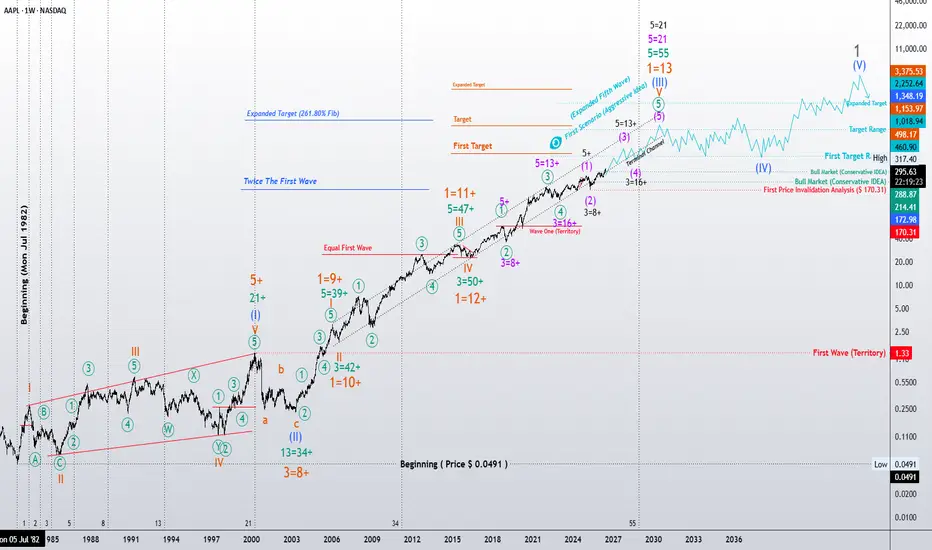
AAPL is not being treated here as a simple price move, but as a long-term, multi-degree Elliott Wave structure.
In this framework, every color represents an independent wave degree, and every target belongs only to the degree from which it is calculated. Therefore, the turquoise projection layer and the deep-blue projection layer should not be interpreted as the same structural path.
The primary bullish scenario is built around the continuation of an Expanded Fifth Wave, while the more conservative alternative follows the logic of a Terminal Channel and a slower higher-degree completion process.
In this methodology, price alone does not complete a wave.
A target can be reached, but the structure is not considered mature until its lower-degree subdivisions are also complete.
Structural confirmation requires three elements to align:
1. Price projection
2. Fibonacci-based timing
3. Lower-degree subdivision completion
The key upside levels on this roadmap are:
498.17
1,018.94
1,153.97
1,348.19
2,252.64
3,375.53
The initial invalidation level for this interpretation is 170.31.
This is not a fixed prediction; it is a structural roadmap based on Elliott Wave logic, Fibonacci relationships, and the fractal evolution of market patterns.
The market does not truly end.
It simply reorganizes its form across different degrees.
Patterns whisper… and I listen.
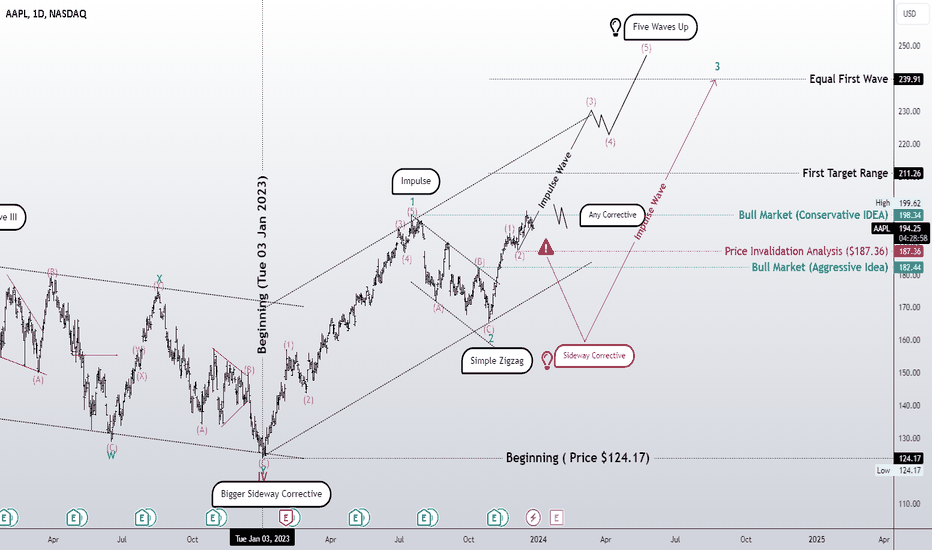
Dec 22, 2023
Continued bullish market or correction of the wave degree?
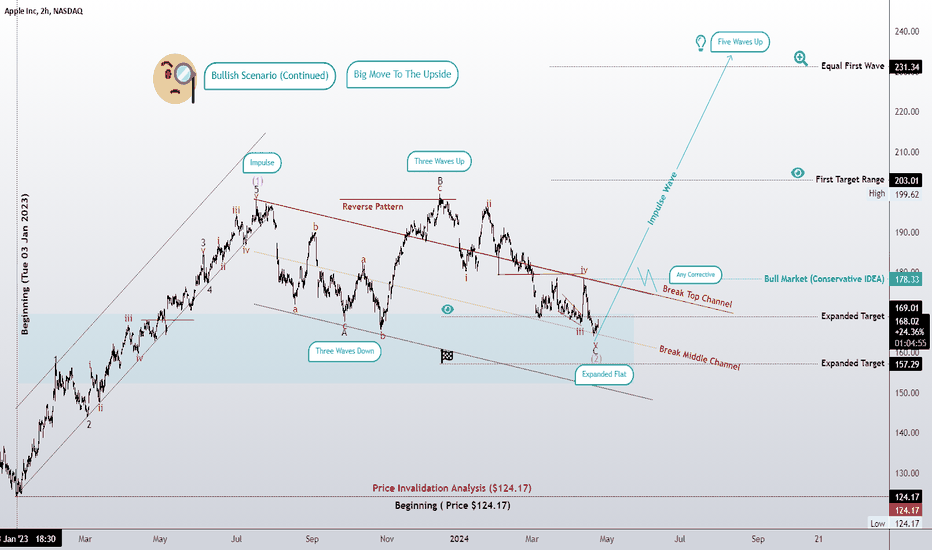
Apr 24, 2024
Bullish Market on Apple
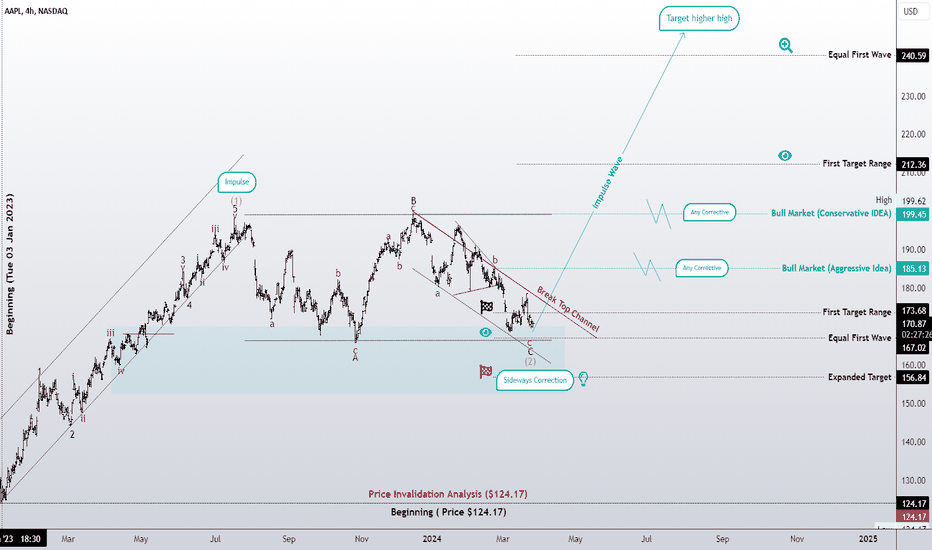
Mar 26, 2024
bullish scenario of the second wave of the sideways correction p
In this framework, every color represents an independent wave degree, and every target belongs only to the degree from which it is calculated. Therefore, the turquoise projection layer and the deep-blue projection layer should not be interpreted as the same structural path.
The primary bullish scenario is built around the continuation of an Expanded Fifth Wave, while the more conservative alternative follows the logic of a Terminal Channel and a slower higher-degree completion process.
In this methodology, price alone does not complete a wave.
A target can be reached, but the structure is not considered mature until its lower-degree subdivisions are also complete.
Structural confirmation requires three elements to align:
1. Price projection
2. Fibonacci-based timing
3. Lower-degree subdivision completion
The key upside levels on this roadmap are:
498.17
1,018.94
1,153.97
1,348.19
2,252.64
3,375.53
The initial invalidation level for this interpretation is 170.31.
This is not a fixed prediction; it is a structural roadmap based on Elliott Wave logic, Fibonacci relationships, and the fractal evolution of market patterns.
The market does not truly end.
It simply reorganizes its form across different degrees.
Patterns whisper… and I listen.
Dec 22, 2023
Continued bullish market or correction of the wave degree?
Apr 24, 2024
Bullish Market on Apple
Mar 26, 2024
bullish scenario of the second wave of the sideways correction p

관련 발행물
면책사항
해당 정보와 게시물은 금융, 투자, 트레이딩 또는 기타 유형의 조언이나 권장 사항으로 간주되지 않으며, 트레이딩뷰에서 제공하거나 보증하는 것이 아닙니다. 자세한 내용은 이용 약관을 참조하세요.
관련 발행물
면책사항
해당 정보와 게시물은 금융, 투자, 트레이딩 또는 기타 유형의 조언이나 권장 사항으로 간주되지 않으며, 트레이딩뷰에서 제공하거나 보증하는 것이 아닙니다. 자세한 내용은 이용 약관을 참조하세요.