롱
Angold Resources (AAU): Potential for big upside
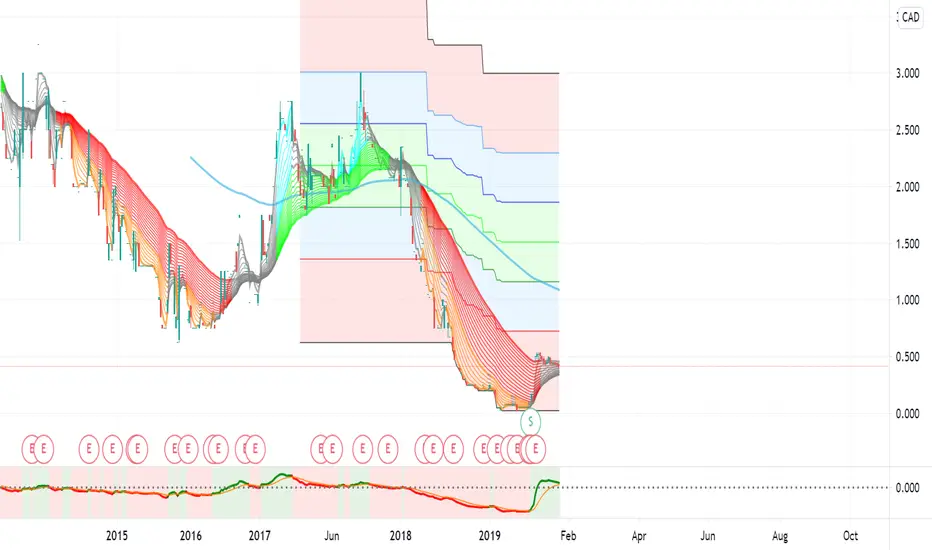
On the 1 day chart for Angold Resources you can see that my super guppy indicator has turned from Red/Orange to grey which indicates incoming volatility and a bounce in price. You can see that the fast EMA's are starting to converge and crossover with the slow EMA's which indicates a bullish reversal may be occurring. When looking at the 1 week chart we can also see a strong signal from our GMMA oscillator. In addition to this we are also starting to see the same convergence and crossover of our fast EMA's and slow EMA's on our 1 week chart that has formed on our 1 day chart. All this indicates a bullish reversal could be underway which would bring some really nice upside.

면책사항
해당 정보와 게시물은 금융, 투자, 트레이딩 또는 기타 유형의 조언이나 권장 사항으로 간주되지 않으며, 트레이딩뷰에서 제공하거나 보증하는 것이 아닙니다. 자세한 내용은 이용 약관을 참조하세요.
면책사항
해당 정보와 게시물은 금융, 투자, 트레이딩 또는 기타 유형의 조언이나 권장 사항으로 간주되지 않으며, 트레이딩뷰에서 제공하거나 보증하는 것이 아닙니다. 자세한 내용은 이용 약관을 참조하세요.