
📈 ABCA (ABC Arbitrage) — Technical Structure Analysis
Chart Visual & Pattern Layout: ChartsSpecialist (via TradingView)
🔍 Technical Observations
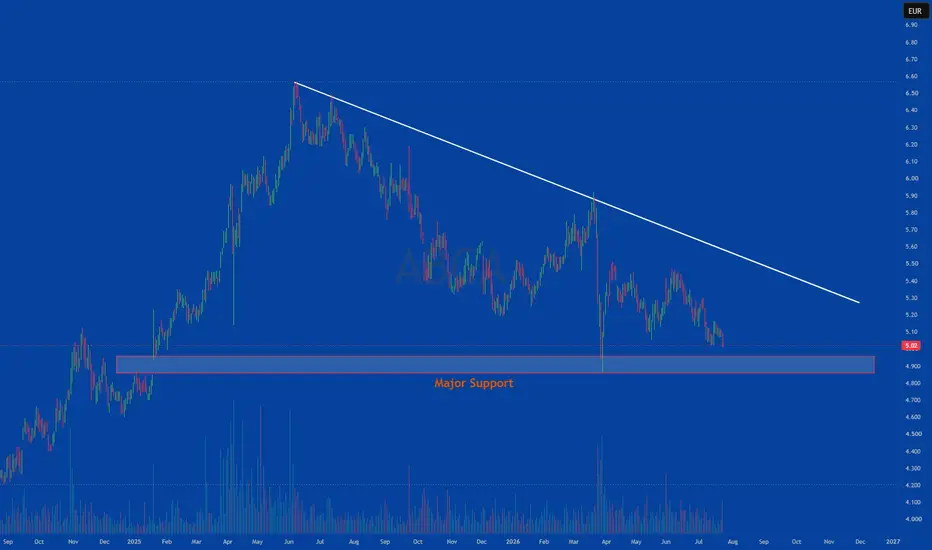
Major Support Zone Re-test: The chart highlights a prominent horizontal demand channel annotated as "Major Support," which historical price action previously bounced from during early-stage advances.
Descending Resistance Trendline: A extended downward-sloping trendline connects successive lower swing highs, acting as active dynamic overhead resistance.
Price Approach to Base: Following rejections at the overhead trendline, price action has steadily pulled back and is currently stabilizing near the upper boundary of the "Major Support" band.
📚 Technical Analysis Concepts Demonstrated
Multi-Month Dynamic Resistance: Observing trendline behavior in prolonged corrective market structures.
Demand Zone Integrity: Analyzing price reaction and volatility contraction as price approaches major horizontal support levels.
Descending Triangle Dynamics: Examining the interaction between a falling resistance line and a flat, horizontal support level.
📌 SEBI Compliant Educational Disclaimer
Regulatory Disclaimer & Disclosures:
Educational Purpose Only: This post analyzes chart patterns and technical concepts strictly for learning and educational purposes.
No Recommendation: This content does NOT contain target levels, stop-loss triggers, entry calls, or buy/sell/hold recommendations.
SEBI Registration Status: ChartsSpecialist and the publisher are NOT SEBI-registered Research Analysts or Investment Advisors.
Risk Warning: Securities trading involves market risk. Past patterns do not guarantee future price movements. Please consult a qualified financial advisor before taking any market positions.
#ChartsSpecialist #ABCA #TechnicalAnalysis #ChartReading #StockMarketEducation #SEBICompliant #PriceAction #TradingView #FinancialLiteracy #SupportAndResistance #Trendlines

면책사항
해당 정보와 게시물은 금융, 투자, 트레이딩 또는 기타 유형의 조언이나 권장 사항으로 간주되지 않으며, 트레이딩뷰에서 제공하거나 보증하는 것이 아닙니다. 자세한 내용은 이용 약관을 참조하세요.
면책사항
해당 정보와 게시물은 금융, 투자, 트레이딩 또는 기타 유형의 조언이나 권장 사항으로 간주되지 않으며, 트레이딩뷰에서 제공하거나 보증하는 것이 아닙니다. 자세한 내용은 이용 약관을 참조하세요.