
ABDL Multi-Month Resistance Breakout Supported by Massive Volume
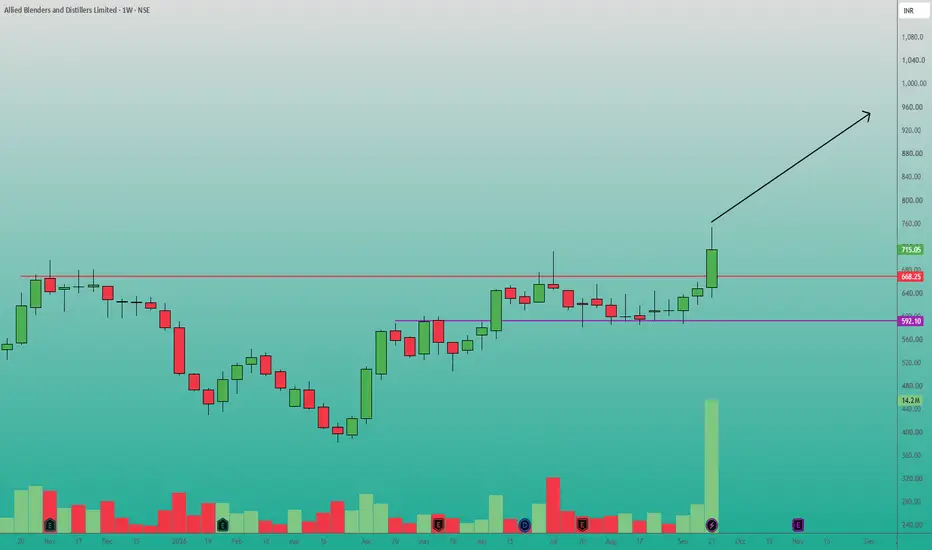
Looking at the weekly chart of Allied Blenders and Distillers Limited, we can observe a strong bullish continuation setup.
The price has officially broken out of a multi-month consolidation phase, surging past the major resistance zone marked by the red horizontal line at 668.25.
A critical factor validating this breakout is the massive spike in buying volume accompanying the current weekly candle.
This high relative volume indicates significant institutional or market interest, suggesting the breakout is genuine rather than a bull trap.
Previously, the stock established a solid foundation above the 592.10 support level (purple line), forming a higher low structure before initiating this upward impulse.
Trade Setup & Plan:
This setup favors a trend-following long position based on the classic breakout-and-retest or momentum continuation strategy.
Entry Point: The stock is currently trading around 715.05. You can consider initiating a partial position at the current market price, but the optimal risk-to-reward entry would be on a minor pullback or retest of the previous resistance-turned-support zone between 670.00 - 680.00.
Target: Based on the depth of the previous consolidation pattern, a measured move projects a primary target around the 850.00 psychological level, with a secondary extended target near 950.00 if the current bullish momentum sustains.
Stop Loss: To manage risk, a stop loss should be placed below the low of the current breakout candle.
A weekly close below 625.00 would invalidate the immediate breakout thesis.
For a wider, more conservative structural stop, place it below the recent consolidation support at 590.00.
The price has officially broken out of a multi-month consolidation phase, surging past the major resistance zone marked by the red horizontal line at 668.25.
A critical factor validating this breakout is the massive spike in buying volume accompanying the current weekly candle.
This high relative volume indicates significant institutional or market interest, suggesting the breakout is genuine rather than a bull trap.
Previously, the stock established a solid foundation above the 592.10 support level (purple line), forming a higher low structure before initiating this upward impulse.
Trade Setup & Plan:
This setup favors a trend-following long position based on the classic breakout-and-retest or momentum continuation strategy.
Entry Point: The stock is currently trading around 715.05. You can consider initiating a partial position at the current market price, but the optimal risk-to-reward entry would be on a minor pullback or retest of the previous resistance-turned-support zone between 670.00 - 680.00.
Target: Based on the depth of the previous consolidation pattern, a measured move projects a primary target around the 850.00 psychological level, with a secondary extended target near 950.00 if the current bullish momentum sustains.
Stop Loss: To manage risk, a stop loss should be placed below the low of the current breakout candle.
A weekly close below 625.00 would invalidate the immediate breakout thesis.
For a wider, more conservative structural stop, place it below the recent consolidation support at 590.00.

면책사항
해당 정보와 게시물은 금융, 투자, 트레이딩 또는 기타 유형의 조언이나 권장 사항으로 간주되지 않으며, 트레이딩뷰에서 제공하거나 보증하는 것이 아닙니다. 자세한 내용은 이용 약관을 참조하세요.
면책사항
해당 정보와 게시물은 금융, 투자, 트레이딩 또는 기타 유형의 조언이나 권장 사항으로 간주되지 않으며, 트레이딩뷰에서 제공하거나 보증하는 것이 아닙니다. 자세한 내용은 이용 약관을 참조하세요.