
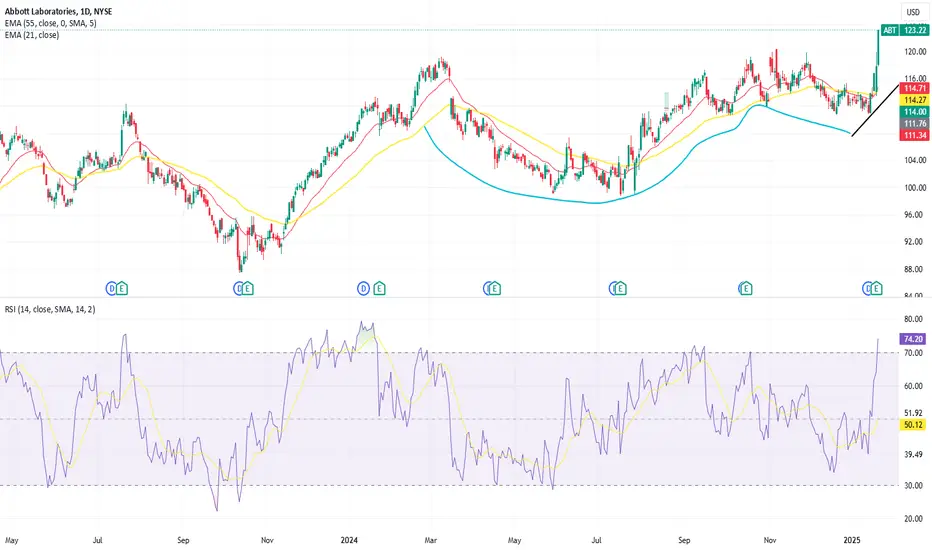
A little late posting this idea but I believe I identified a cup - and- handle pattern on the daily chart in ABT. I was able to enter the trade in the pull back of the 'handle' when volume was starting to dry up at $113.25. Prior to the formation of the pattern there was a ~29% run up on the stock. Playing this conservatively I am setting my price targets at 12% ($134.40) and 24% ($148.8) above the high of the pattern. Where I will sell half of my position at the first target and the second half at the second target. Initially my first Stop Loss is set just beneath the 'handle' at $106.99


면책사항
해당 정보와 게시물은 금융, 투자, 트레이딩 또는 기타 유형의 조언이나 권장 사항으로 간주되지 않으며, 트레이딩뷰에서 제공하거나 보증하는 것이 아닙니다. 자세한 내용은 이용 약관을 참조하세요.
면책사항
해당 정보와 게시물은 금융, 투자, 트레이딩 또는 기타 유형의 조언이나 권장 사항으로 간주되지 않으며, 트레이딩뷰에서 제공하거나 보증하는 것이 아닙니다. 자세한 내용은 이용 약관을 참조하세요.