
Hello Traders,
I am back for another AC technical analysis.
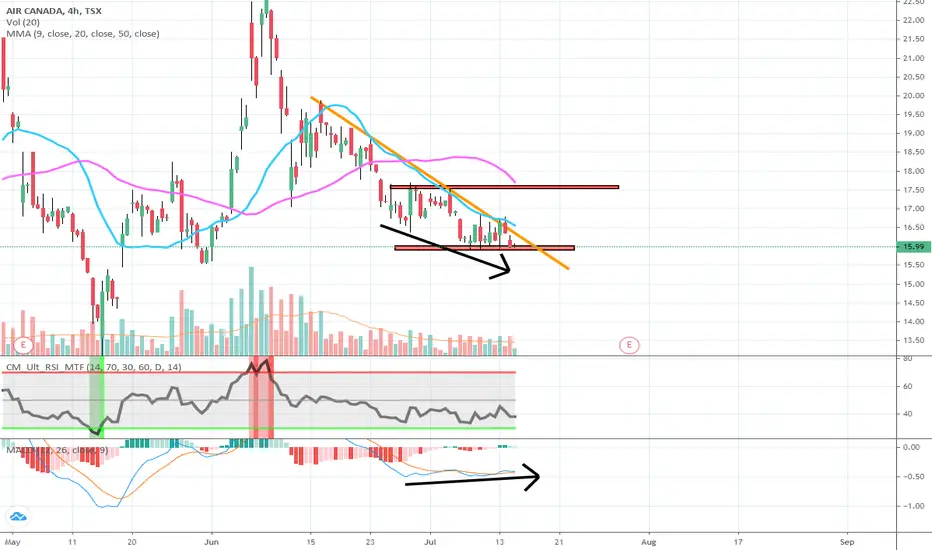
Looking at the 4 hour chart, we can see that AC has been in down-trend since June 20th high, as the price has been rejected multiple times at 4-hourly 20MA.
However, few bullish signals have emerged:
1) Bullish divergence in price and MACD
2) $15.90 has been tested multiple times and bears are failing to break this support
If AC breaks orange trend line with convincing volume, we can expect the price to hit $17.50 in short term.
Stop loss: $15.85
Happy trading.
I am back for another AC technical analysis.
Looking at the 4 hour chart, we can see that AC has been in down-trend since June 20th high, as the price has been rejected multiple times at 4-hourly 20MA.
However, few bullish signals have emerged:
1) Bullish divergence in price and MACD
2) $15.90 has been tested multiple times and bears are failing to break this support
If AC breaks orange trend line with convincing volume, we can expect the price to hit $17.50 in short term.
Stop loss: $15.85
Happy trading.
노트
And here it is strong bounce from $16 :)
관련 발행물
면책사항
해당 정보와 게시물은 금융, 투자, 트레이딩 또는 기타 유형의 조언이나 권장 사항으로 간주되지 않으며, 트레이딩뷰에서 제공하거나 보증하는 것이 아닙니다. 자세한 내용은 이용 약관을 참조하세요.
면책사항
해당 정보와 게시물은 금융, 투자, 트레이딩 또는 기타 유형의 조언이나 권장 사항으로 간주되지 않으며, 트레이딩뷰에서 제공하거나 보증하는 것이 아닙니다. 자세한 내용은 이용 약관을 참조하세요.