
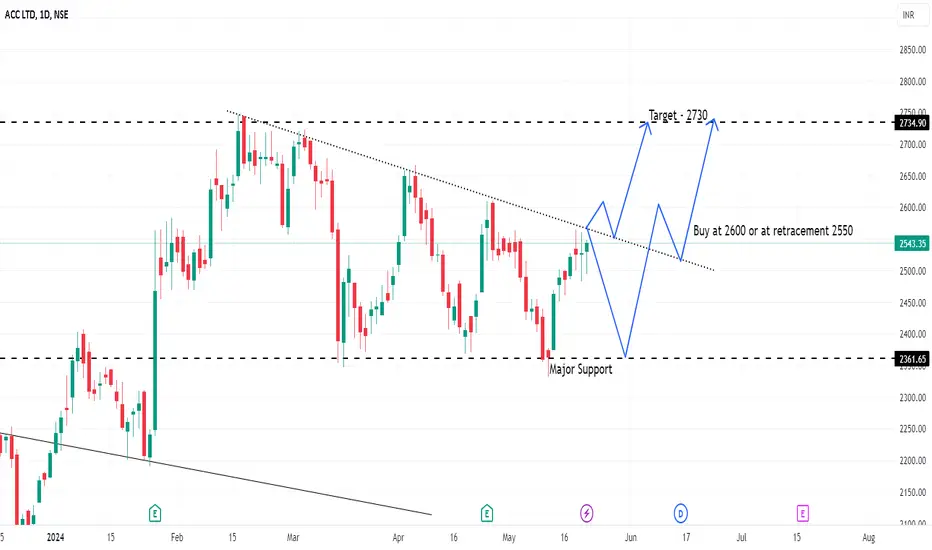
The chart is a daily candlestick chart of ACC Ltd. (ACC) on the NSE, with the current price at INR 2,543.35. The chart shows a descending triangle pattern, highlighting a major support level and potential trade strategies based on key price levels.
Key Observations:
1. Current Price and Trend:
- The current price is INR 2,543.35, showing a slight increase of 0.61%.
- The price is near the upper boundary of the descending triangle pattern.
2. Support and Resistance Levels:
- Major support is at INR 2,361.65.
- Resistance is indicated around the INR 2,600 level and higher at INR 2,734.90 (target).
3. Descending Triangle Pattern:
- The chart shows a descending triangle pattern, suggesting potential for either a breakout or continued consolidation.
- The upper trendline acts as a dynamic resistance.
4. Trade Strategies:
- Buy Strategy:
- If the price breaks above INR 2,600, it signals a potential bullish breakout.
- Traders could buy at the breakout level of INR 2,600.
- Alternatively, traders can wait for a retracement and buy at INR 2,550 for better entry.
- The target for this buy strategy is INR 2,730.
- Sell Strategy:
- If the price fails to break out and moves downward, keeping an eye on the major support at INR 2,361.65 is crucial.
- A break below this major support could indicate further downside potential.
Summary:
The chart of ACC Ltd. indicates a descending triangle pattern, with the current price near the upper boundary. Major support is at INR 2,361.65, and resistance is around INR 2,600, with a target for a bullish breakout at INR 2,730. Traders are advised to watch for a breakout above INR 2,600 for a buy opportunity, with a potential entry at INR 2,550 on retracement. Conversely, a failure to break out and a move towards major support could suggest caution or potential downside risks.
Key Observations:
1. Current Price and Trend:
- The current price is INR 2,543.35, showing a slight increase of 0.61%.
- The price is near the upper boundary of the descending triangle pattern.
2. Support and Resistance Levels:
- Major support is at INR 2,361.65.
- Resistance is indicated around the INR 2,600 level and higher at INR 2,734.90 (target).
3. Descending Triangle Pattern:
- The chart shows a descending triangle pattern, suggesting potential for either a breakout or continued consolidation.
- The upper trendline acts as a dynamic resistance.
4. Trade Strategies:
- Buy Strategy:
- If the price breaks above INR 2,600, it signals a potential bullish breakout.
- Traders could buy at the breakout level of INR 2,600.
- Alternatively, traders can wait for a retracement and buy at INR 2,550 for better entry.
- The target for this buy strategy is INR 2,730.
- Sell Strategy:
- If the price fails to break out and moves downward, keeping an eye on the major support at INR 2,361.65 is crucial.
- A break below this major support could indicate further downside potential.
Summary:
The chart of ACC Ltd. indicates a descending triangle pattern, with the current price near the upper boundary. Major support is at INR 2,361.65, and resistance is around INR 2,600, with a target for a bullish breakout at INR 2,730. Traders are advised to watch for a breakout above INR 2,600 for a buy opportunity, with a potential entry at INR 2,550 on retracement. Conversely, a failure to break out and a move towards major support could suggest caution or potential downside risks.

면책사항
해당 정보와 게시물은 금융, 투자, 트레이딩 또는 기타 유형의 조언이나 권장 사항으로 간주되지 않으며, 트레이딩뷰에서 제공하거나 보증하는 것이 아닙니다. 자세한 내용은 이용 약관을 참조하세요.
면책사항
해당 정보와 게시물은 금융, 투자, 트레이딩 또는 기타 유형의 조언이나 권장 사항으로 간주되지 않으며, 트레이딩뷰에서 제공하거나 보증하는 것이 아닙니다. 자세한 내용은 이용 약관을 참조하세요.