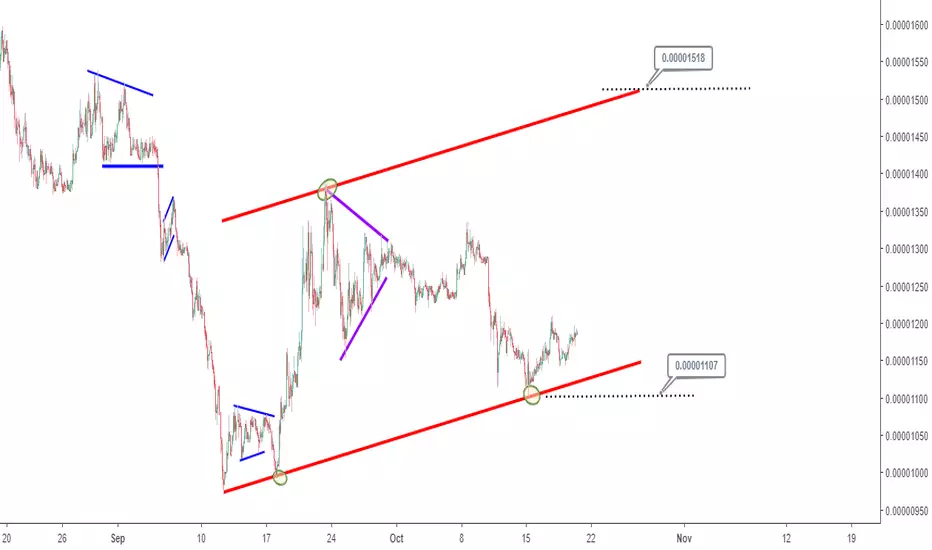
The 2 hour timeframe of Cardano (ADABTC) is shown in this analysis from August 19, 2018 till current date. The most recent chart pattern that captures price action of Cardano from September 12, 2018 onwards is a bullish price channel.
~0.00001518 and 0.00001107 are marked as price levels to pay attention to as a breakout above the former indicates resumption of upside momentum with the channel width serving as a guide to estimate the minimum expectation for a bullish price swing.
A breakout below the latter however implies a continuation of the already established downtrend in Cardano.
~0.00001518 and 0.00001107 are marked as price levels to pay attention to as a breakout above the former indicates resumption of upside momentum with the channel width serving as a guide to estimate the minimum expectation for a bullish price swing.
A breakout below the latter however implies a continuation of the already established downtrend in Cardano.

관련 발행물
면책사항
해당 정보와 게시물은 금융, 투자, 트레이딩 또는 기타 유형의 조언이나 권장 사항으로 간주되지 않으며, 트레이딩뷰에서 제공하거나 보증하는 것이 아닙니다. 자세한 내용은 이용 약관을 참조하세요.
관련 발행물
면책사항
해당 정보와 게시물은 금융, 투자, 트레이딩 또는 기타 유형의 조언이나 권장 사항으로 간주되지 않으며, 트레이딩뷰에서 제공하거나 보증하는 것이 아닙니다. 자세한 내용은 이용 약관을 참조하세요.