
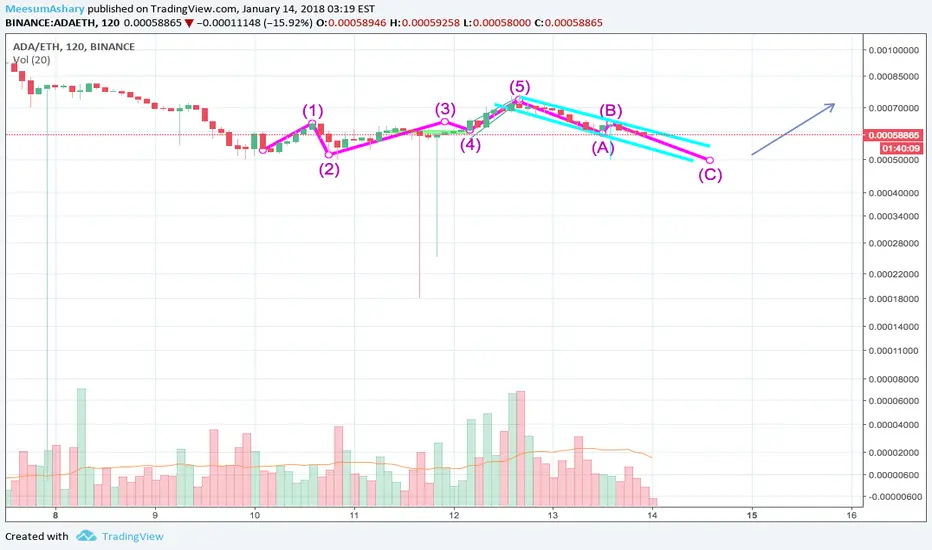
The Elliot Wave pattern shows that, after the ABC correction (Pink), prices will rise again for a while following a 1,2,3,4,5 Elliot wave.
The possible bullish trend is also confirmed by the flag pattern (Teal) seen around the ABC correction. We know that the flag pattern is a continuous pattern. This indicates that after the graph breaks out of the flag, it will resume its previous pattern. Which in this case, was a bullish trend.
Feel free to critique this analysis, as I am still fairly new to this.
The possible bullish trend is also confirmed by the flag pattern (Teal) seen around the ABC correction. We know that the flag pattern is a continuous pattern. This indicates that after the graph breaks out of the flag, it will resume its previous pattern. Which in this case, was a bullish trend.
Feel free to critique this analysis, as I am still fairly new to this.

면책사항
해당 정보와 게시물은 금융, 투자, 트레이딩 또는 기타 유형의 조언이나 권장 사항으로 간주되지 않으며, 트레이딩뷰에서 제공하거나 보증하는 것이 아닙니다. 자세한 내용은 이용 약관을 참조하세요.
면책사항
해당 정보와 게시물은 금융, 투자, 트레이딩 또는 기타 유형의 조언이나 권장 사항으로 간주되지 않으며, 트레이딩뷰에서 제공하거나 보증하는 것이 아닙니다. 자세한 내용은 이용 약관을 참조하세요.