
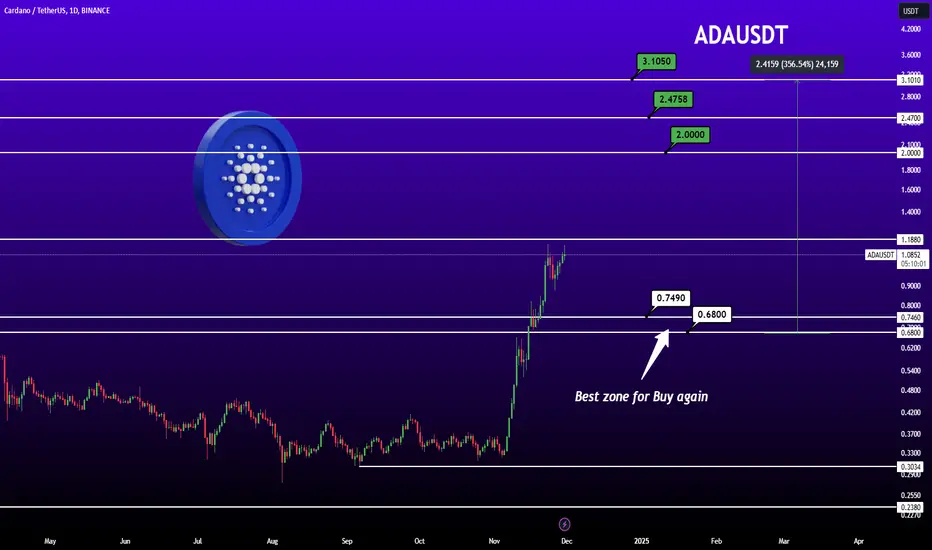
🚀 ADA/USDT Price Analysis
The Cardano (ADA) chart shows strong bullish momentum, with prices climbing steadily. Here's a breakdown of key levels:
🔼 Resistance Zones to Watch:
$2.00 🛑: First major resistance. Breaking this could signal a rally.
$2.4758 🛑: A critical level for medium-term targets.
$3.1050 🛑: Long-term price target if the bullish trend holds.
🔽 Support Zones for Buying:
$0.7490 ✅: A solid support zone where buyers previously stepped in.
$0.6800 ✅: Highlighted as the "Best Zone for Buy Again" – ideal for re-entry during corrections.
📈 Upside Potential:
If the bullish trend continues, ADA has a 356% growth potential, aiming for $2.4159 and beyond!
💡 Takeaway:
The current trend favors bulls, but a pullback to support zones could provide better entry opportunities. Keep an eye on trading volumes and breakout confirmations at resistance levels!

관련 발행물
면책사항
해당 정보와 게시물은 금융, 투자, 트레이딩 또는 기타 유형의 조언이나 권장 사항으로 간주되지 않으며, 트레이딩뷰에서 제공하거나 보증하는 것이 아닙니다. 자세한 내용은 이용 약관을 참조하세요.
면책사항
해당 정보와 게시물은 금융, 투자, 트레이딩 또는 기타 유형의 조언이나 권장 사항으로 간주되지 않으며, 트레이딩뷰에서 제공하거나 보증하는 것이 아닙니다. 자세한 내용은 이용 약관을 참조하세요.