
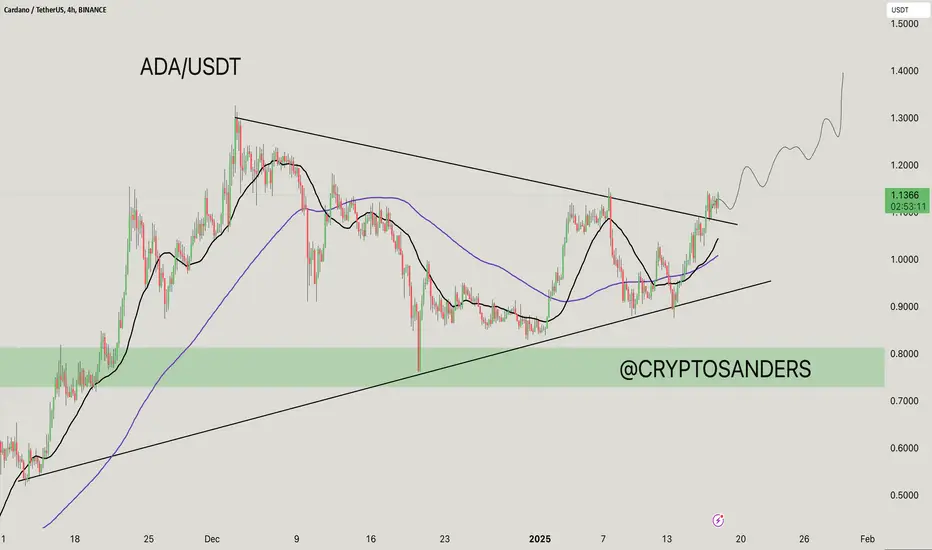
ADA/USDT 4-hour chart shows a bullish continuation pattern as Cardano prepares for a potential breakout after a period of consolidation.
The price is making higher lows, indicated by the rising trendline.
Resistance lies at $1.20, which aligns with the upper boundary of the triangle.
Support: $0.80–$0.90 (green area and trendline).
Resistance: $1.20 (key breakout level).
The 21-day MA and 100-day MA are sloping upwards, indicating bullish momentum.
The price is currently above both MAs, which provide additional support.
If ADA breaks above $1.20, it could head towards $1.50 or higher.
However, a breakdown below the rising trendline could lead to a retest of $0.80.
This setup suggests that ADA is gaining strength, with bullish continuation likely on the breakout.
If you found this analysis helpful, hit the Like button and share your thoughts or questions in the comments below. Your feedback matters!
Thanks for your support!
DYOR. NFA
The price is making higher lows, indicated by the rising trendline.
Resistance lies at $1.20, which aligns with the upper boundary of the triangle.
Support: $0.80–$0.90 (green area and trendline).
Resistance: $1.20 (key breakout level).
The 21-day MA and 100-day MA are sloping upwards, indicating bullish momentum.
The price is currently above both MAs, which provide additional support.
If ADA breaks above $1.20, it could head towards $1.50 or higher.
However, a breakdown below the rising trendline could lead to a retest of $0.80.
This setup suggests that ADA is gaining strength, with bullish continuation likely on the breakout.
If you found this analysis helpful, hit the Like button and share your thoughts or questions in the comments below. Your feedback matters!
Thanks for your support!
DYOR. NFA

관련 발행물
면책사항
해당 정보와 게시물은 금융, 투자, 트레이딩 또는 기타 유형의 조언이나 권장 사항으로 간주되지 않으며, 트레이딩뷰에서 제공하거나 보증하는 것이 아닙니다. 자세한 내용은 이용 약관을 참조하세요.
관련 발행물
면책사항
해당 정보와 게시물은 금융, 투자, 트레이딩 또는 기타 유형의 조언이나 권장 사항으로 간주되지 않으며, 트레이딩뷰에서 제공하거나 보증하는 것이 아닙니다. 자세한 내용은 이용 약관을 참조하세요.