
🦉 Welcome To SatoshiFrame Tradingview Channel.
⛳️ Lets dive into a Cardano analysis.
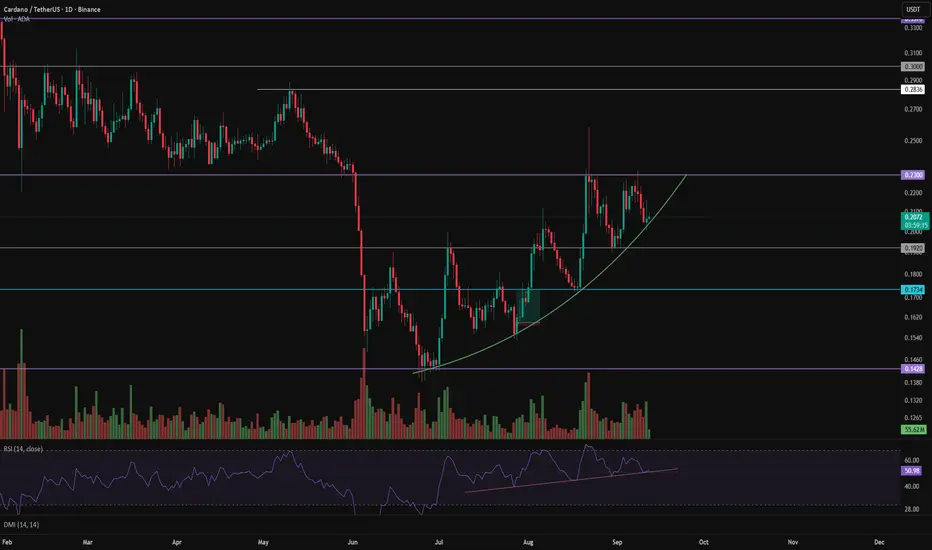
🤑 Following its recent declines, Cardano found support at the weekly level of $0.1428. It then staged a corrective rebound, forming a series of higher highs and higher lows.
⛏ This rebound has retraced 100% of the most recent decline. Price has also been forming higher lows along the green curved support line and is now trading below the weekly resistance at $0.2300.
✅ If buyers manage to defend the current support area and establish a higher low above $0.1920, a breakout above the $0.2300 weekly resistance could push the price toward the next resistance levels.
💡 Conversely, if the current support area fails to hold and selling pressure drives the price below the $0.1920 low, Cardano could move toward its next support levels.
🧮 The RSI has also been forming higher lows along a trendline. However, it recently formed a lower swing high compared with its previous peak, suggesting that bullish momentum has weakened slightly.
⚠️ Risk management and capital management are essential in trading. Always trade based on your own strategy and risk tolerance. Every trading decision and its outcome are entirely your own responsibility.
⛳️ Lets dive into a Cardano analysis.
🤑 Following its recent declines, Cardano found support at the weekly level of $0.1428. It then staged a corrective rebound, forming a series of higher highs and higher lows.
⛏ This rebound has retraced 100% of the most recent decline. Price has also been forming higher lows along the green curved support line and is now trading below the weekly resistance at $0.2300.
✅ If buyers manage to defend the current support area and establish a higher low above $0.1920, a breakout above the $0.2300 weekly resistance could push the price toward the next resistance levels.
💡 Conversely, if the current support area fails to hold and selling pressure drives the price below the $0.1920 low, Cardano could move toward its next support levels.
🧮 The RSI has also been forming higher lows along a trendline. However, it recently formed a lower swing high compared with its previous peak, suggesting that bullish momentum has weakened slightly.
⚠️ Risk management and capital management are essential in trading. Always trade based on your own strategy and risk tolerance. Every trading decision and its outcome are entirely your own responsibility.

관련 발행물
면책사항
해당 정보와 게시물은 금융, 투자, 트레이딩 또는 기타 유형의 조언이나 권장 사항으로 간주되지 않으며, 트레이딩뷰에서 제공하거나 보증하는 것이 아닙니다. 자세한 내용은 이용 약관을 참조하세요.
면책사항
해당 정보와 게시물은 금융, 투자, 트레이딩 또는 기타 유형의 조언이나 권장 사항으로 간주되지 않으며, 트레이딩뷰에서 제공하거나 보증하는 것이 아닙니다. 자세한 내용은 이용 약관을 참조하세요.