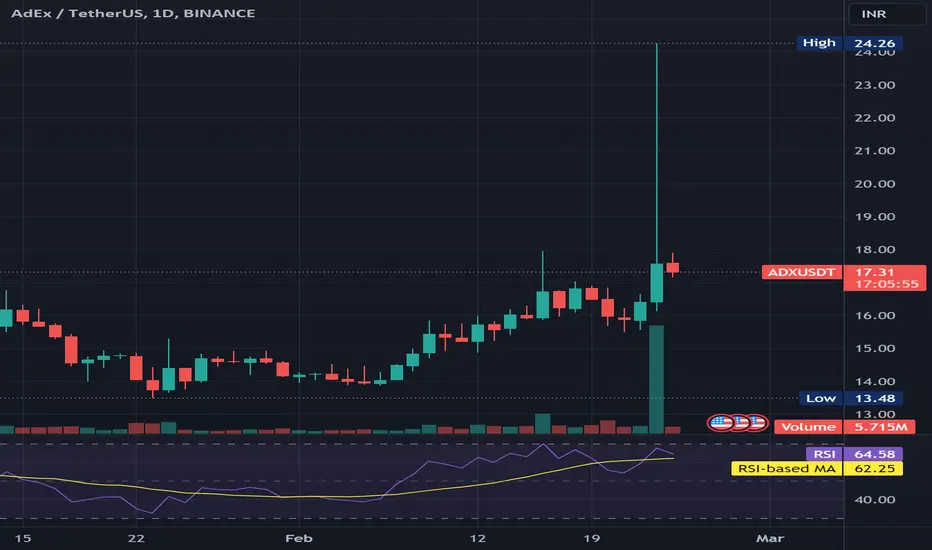
The image you provided appears to be a cryptocurrency trading chart for AdEx (ADX) against Tether (USDT) on the Binance exchange. Here are some observations based on the chart:
Price Movement:
The chart shows candlestick bars representing price movements.
A significant green candlestick around February 19 indicates a sharp increase in price.
However, there have been fluctuations before and after that date.
Indicators:
Below the main chart, there are two indicators:
Volume: Represents trading volume.
RSI-based MA: Indicates whether the asset is overbought or oversold.
Price Range:
The price of ADX against USDT has fluctuated between approximately 13 INR and 24.26 INR.
Please note that I cannot provide real-time or future predictions based on this historical data. If you’re trading, consider consulting professional financial advice or using real-time analysis tools. 📈🚀
 ADXUSDT
Price Movement:
The chart shows candlestick bars representing price movements.
A significant green candlestick around February 19 indicates a sharp increase in price.
However, there have been fluctuations before and after that date.
Indicators:
Below the main chart, there are two indicators:
Volume: Represents trading volume.
RSI-based MA: Indicates whether the asset is overbought or oversold.
Price Range:
The price of ADX against USDT has fluctuated between approximately 13 INR and 24.26 INR.
Please note that I cannot provide real-time or future predictions based on this historical data. If you’re trading, consider consulting professional financial advice or using real-time analysis tools. 📈🚀
ADXUSDT 
면책사항
해당 정보와 게시물은 금융, 투자, 트레이딩 또는 기타 유형의 조언이나 권장 사항으로 간주되지 않으며, 트레이딩뷰에서 제공하거나 보증하는 것이 아닙니다. 자세한 내용은 이용 약관을 참조하세요.
면책사항
해당 정보와 게시물은 금융, 투자, 트레이딩 또는 기타 유형의 조언이나 권장 사항으로 간주되지 않으며, 트레이딩뷰에서 제공하거나 보증하는 것이 아닙니다. 자세한 내용은 이용 약관을 참조하세요.