숏
AE/BTC 1D
Hello friends
We are here AE/BTC charts see
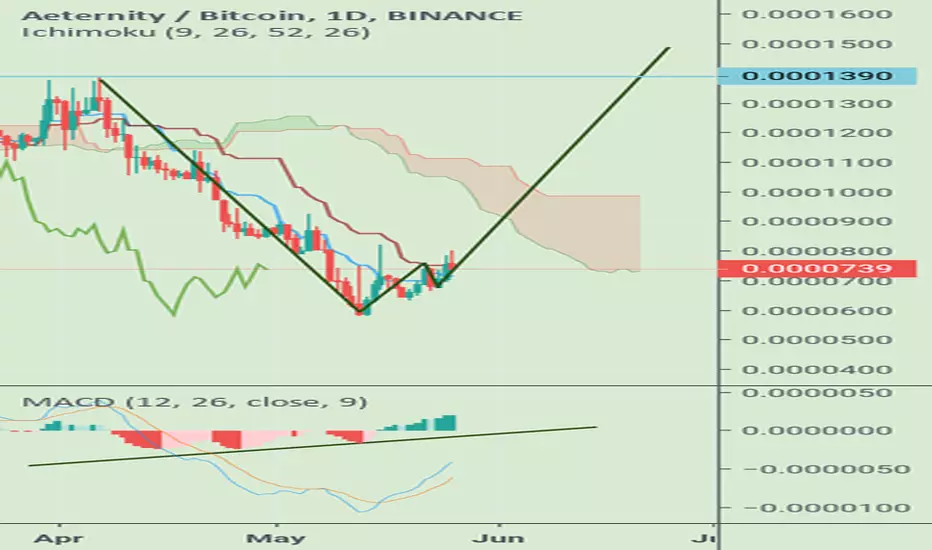
1.In the daily chart after 49 days opens candel top of the "Tenkan sen" line on ichimuko indicator ; this means the break resistance short term
2.buliesh divergens in macd indicator
3.nice double bottom pattern in this chart
So i think in short time we see 1500sat but in 1390sat area we have big resistance
I hope this analysis be useful to you. Definitely a financial advice is not

면책사항
해당 정보와 게시물은 금융, 투자, 트레이딩 또는 기타 유형의 조언이나 권장 사항으로 간주되지 않으며, 트레이딩뷰에서 제공하거나 보증하는 것이 아닙니다. 자세한 내용은 이용 약관을 참조하세요.
면책사항
해당 정보와 게시물은 금융, 투자, 트레이딩 또는 기타 유형의 조언이나 권장 사항으로 간주되지 않으며, 트레이딩뷰에서 제공하거나 보증하는 것이 아닙니다. 자세한 내용은 이용 약관을 참조하세요.