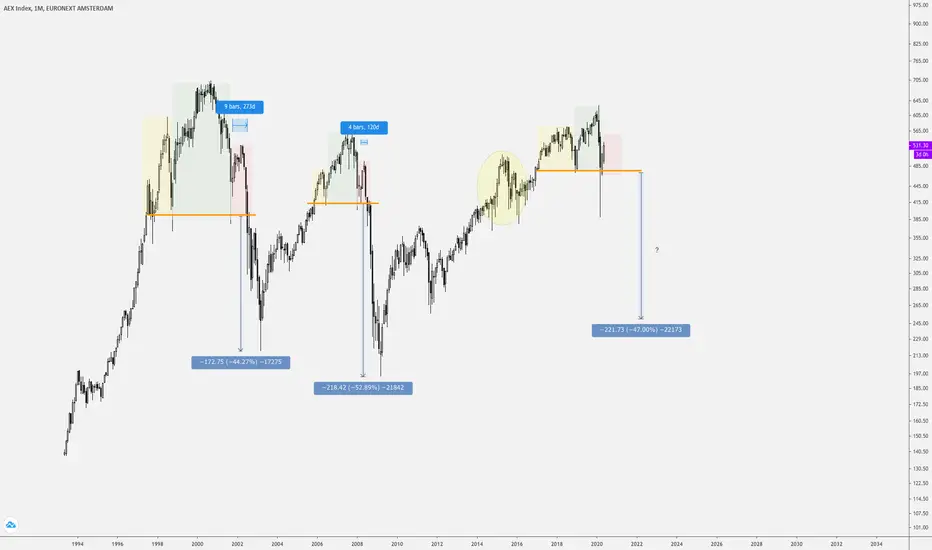
Looking at the  AEX i chart, this bearish pattern is quite easy to spot. At the previous two tops AEX printed:
I’m not a big fan of Head and Shoulder patterns but this one is too obvious to ignore. The current pattern we’re in can be drawn in two ways. The one I have and one with the yellow circle as the left shoulder.
So obviously this would mean a big drop would happen if this one plays out (I’m not convinced). The AEX is a capitalization-weighted-index with three companies having a total weight of 43,46%(!) of the total index:
It’s interesting to watch how these company go through the Corona pandemic.
Why is this pattern useful? Invalidation is nearby. If we surpass the green zone it’s likely the ‘corona-low’ is already in and we go for new highs.
This is just an idea.
AEX i chart, this bearish pattern is quite easy to spot. At the previous two tops AEX printed:- A high (yellow)
- Followed by a higher high with a drop to the low of the yellow zone (green)
- Followed by a retracement to around mid green zone and a big dump (red)
- Retest of support turned resistance (orange) with a final big dump afterwards.
I’m not a big fan of Head and Shoulder patterns but this one is too obvious to ignore. The current pattern we’re in can be drawn in two ways. The one I have and one with the yellow circle as the left shoulder.
So obviously this would mean a big drop would happen if this one plays out (I’m not convinced). The AEX is a capitalization-weighted-index with three companies having a total weight of 43,46%(!) of the total index:
- ASML Holding (semiconductors)
- Royal Dutch Shell (oil & gas)
- Unilever (personal products)
It’s interesting to watch how these company go through the Corona pandemic.
Why is this pattern useful? Invalidation is nearby. If we surpass the green zone it’s likely the ‘corona-low’ is already in and we go for new highs.
This is just an idea.

면책사항
해당 정보와 게시물은 금융, 투자, 트레이딩 또는 기타 유형의 조언이나 권장 사항으로 간주되지 않으며, 트레이딩뷰에서 제공하거나 보증하는 것이 아닙니다. 자세한 내용은 이용 약관을 참조하세요.
면책사항
해당 정보와 게시물은 금융, 투자, 트레이딩 또는 기타 유형의 조언이나 권장 사항으로 간주되지 않으며, 트레이딩뷰에서 제공하거나 보증하는 것이 아닙니다. 자세한 내용은 이용 약관을 참조하세요.