숏
A Corrective Mess
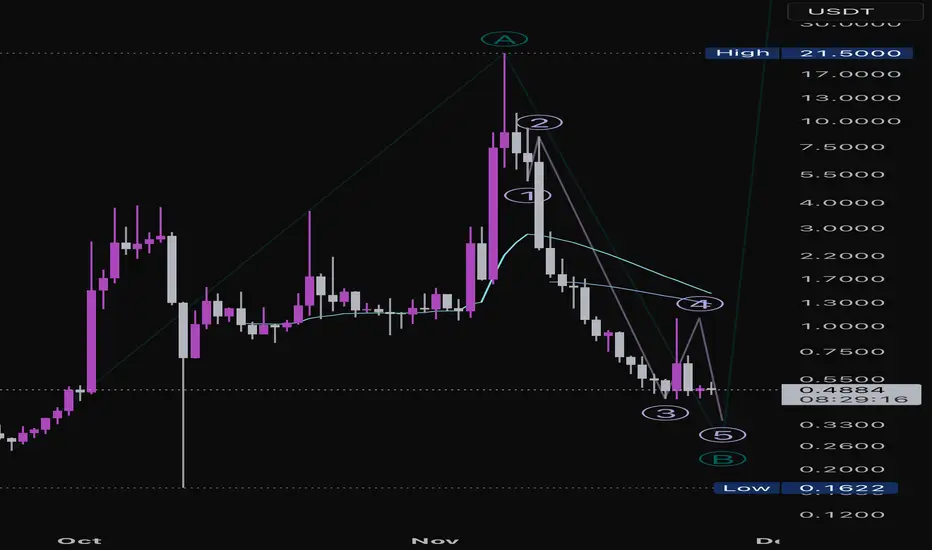
Hard to count this chart as anything but long-term bearish, but my best Elliot interpretation of AIA is that we could be in wave 4 of C of B to the downside. Very short term, we could see another [relatively] small rally to the 1.09-1.3ish area, but volume is low and further downside is expected with or without a C wave up. A break above the intraday high would be a first signal for a C wave, break below 0.439 for larger trend continuation.
노트
Clarification: very short-term possibility is Wave c of 4, not Wave C of larger ABC count. Standard Fibonacci extension targets if we do get a Wave c of 4 rally: 1.09-1.49
면책사항
해당 정보와 게시물은 금융, 투자, 트레이딩 또는 기타 유형의 조언이나 권장 사항으로 간주되지 않으며, 트레이딩뷰에서 제공하거나 보증하는 것이 아닙니다. 자세한 내용은 이용 약관을 참조하세요.
면책사항
해당 정보와 게시물은 금융, 투자, 트레이딩 또는 기타 유형의 조언이나 권장 사항으로 간주되지 않으며, 트레이딩뷰에서 제공하거나 보증하는 것이 아닙니다. 자세한 내용은 이용 약관을 참조하세요.