
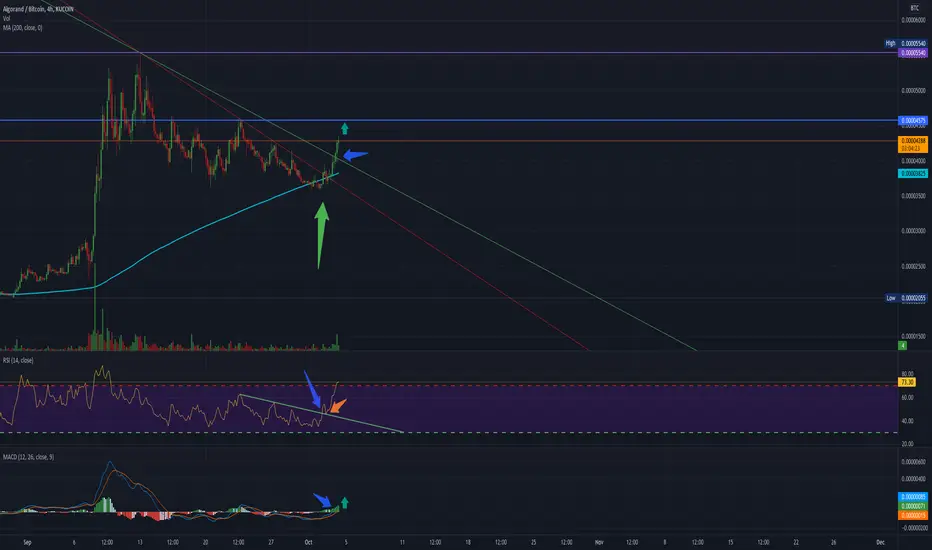
Here is a quick analysis of the ALGO/BTC chart pumping.
Next targets are resistances marked in horizontal ray blue at 4575 sats & purple at 5540 sats per ALGO coin.
Big green arrow shows how the trend tested the 200 MA and bounced off of it making to break the downtrend channel that was created.
RSI indicator shows how once the downtrend was broken (blue small arrow), it backtested before mooning (orange small arrow).
MACD Showing how positive momentum is building up... :)
노트
LOLOLOLOL
면책사항
해당 정보와 게시물은 금융, 투자, 트레이딩 또는 기타 유형의 조언이나 권장 사항으로 간주되지 않으며, 트레이딩뷰에서 제공하거나 보증하는 것이 아닙니다. 자세한 내용은 이용 약관을 참조하세요.
면책사항
해당 정보와 게시물은 금융, 투자, 트레이딩 또는 기타 유형의 조언이나 권장 사항으로 간주되지 않으며, 트레이딩뷰에서 제공하거나 보증하는 것이 아닙니다. 자세한 내용은 이용 약관을 참조하세요.