
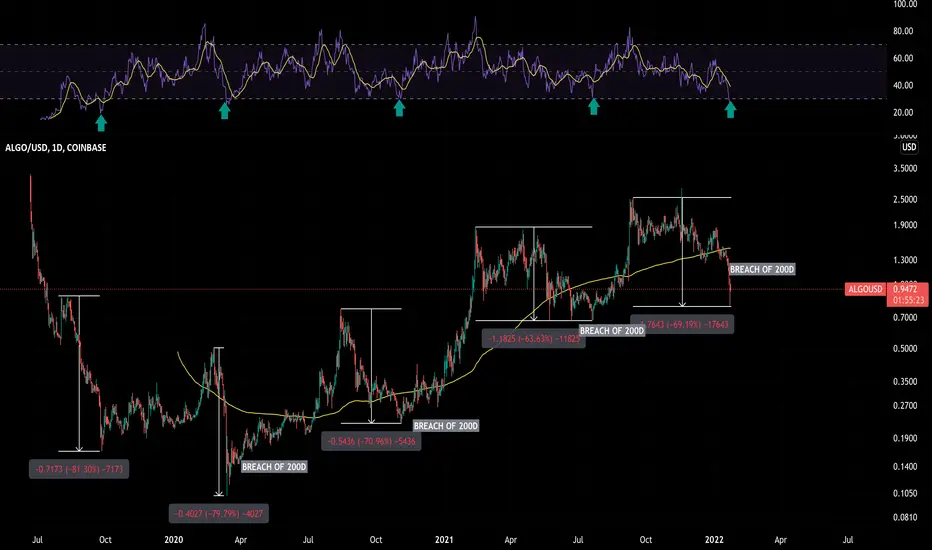
Based on the long-term daily log chart of Algorand, it looks like RSI has reached a low where it normally bounces relative to previous large declines greater than 60% when the 200D moving average was breached.
This RSI level has signaled a bounce back 4 times before since the inception of Algorand. The probability that this will be the 5th time is very high. History doesn't repeat itself but it often rhymes.
This has been the 4th worst decline besides the initial puking of ALGO which I don't count. The 5th worst, or the least bad, was a 64% decline. Right now we're at about 69% of a decline. The worst was an 81% decline.
I don't think we have any more room to the downside since 100% of the time (4/4) the RSI has hit that magic low level, the trend changes from bearish to bullish after a breach of the 200-day moving average.
액티브 트레이드
inverse h&S and positive RSI divergence
관련 발행물
면책사항
해당 정보와 게시물은 금융, 투자, 트레이딩 또는 기타 유형의 조언이나 권장 사항으로 간주되지 않으며, 트레이딩뷰에서 제공하거나 보증하는 것이 아닙니다. 자세한 내용은 이용 약관을 참조하세요.
면책사항
해당 정보와 게시물은 금융, 투자, 트레이딩 또는 기타 유형의 조언이나 권장 사항으로 간주되지 않으며, 트레이딩뷰에서 제공하거나 보증하는 것이 아닙니다. 자세한 내용은 이용 약관을 참조하세요.