
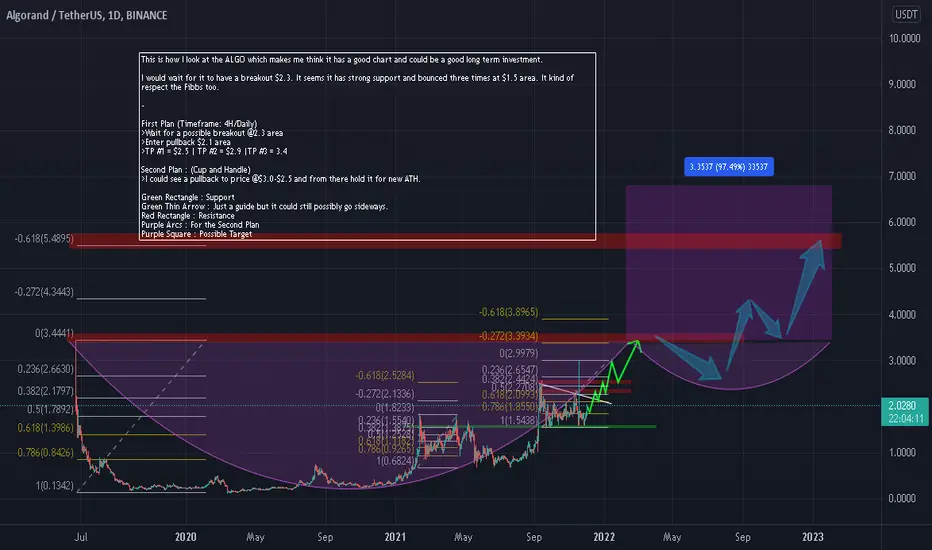
This is how I look at the ALGO which makes me think it has a beautiful chart and could be a good long term investment.
-
First Plan (Timeframe: 4H/Daily)
>Wait for a possible breakout @2.3 area
>Enter pullback $2.1 area
>TP #1 = $2.5 | TP #2 = $2.9 |TP #3 = 3.4
Second Plan : (Cup and Handle)
>I could see a pullback to price @$3.0-$2.5 and from there hold it for new ATH.
Green Rectangle : Support
Green Thin Arrow : Just a guide but it could still possibly go sideways.
Red Rectangle : Resistance
Purple Arcs : For the Second Plan
Purple Square : Possible Target
-
This is just my own opinion that I would possibly follow.
Comment your idea and suggestion that could make this idea so much better and right, thank you!
-
First Plan (Timeframe: 4H/Daily)
>Wait for a possible breakout @2.3 area
>Enter pullback $2.1 area
>TP #1 = $2.5 | TP #2 = $2.9 |TP #3 = 3.4
Second Plan : (Cup and Handle)
>I could see a pullback to price @$3.0-$2.5 and from there hold it for new ATH.
Green Rectangle : Support
Green Thin Arrow : Just a guide but it could still possibly go sideways.
Red Rectangle : Resistance
Purple Arcs : For the Second Plan
Purple Square : Possible Target
-
This is just my own opinion that I would possibly follow.
Comment your idea and suggestion that could make this idea so much better and right, thank you!

면책사항
해당 정보와 게시물은 금융, 투자, 트레이딩 또는 기타 유형의 조언이나 권장 사항으로 간주되지 않으며, 트레이딩뷰에서 제공하거나 보증하는 것이 아닙니다. 자세한 내용은 이용 약관을 참조하세요.
면책사항
해당 정보와 게시물은 금융, 투자, 트레이딩 또는 기타 유형의 조언이나 권장 사항으로 간주되지 않으며, 트레이딩뷰에서 제공하거나 보증하는 것이 아닙니다. 자세한 내용은 이용 약관을 참조하세요.