
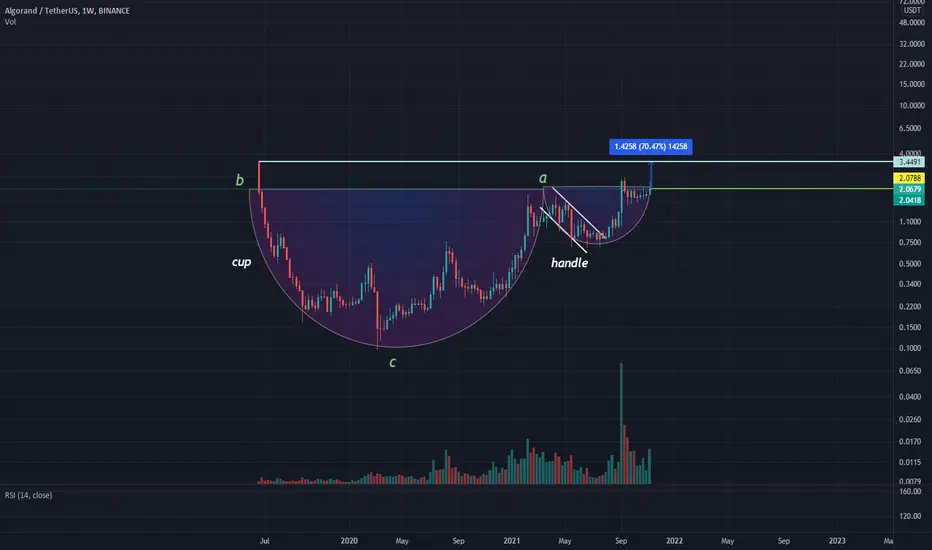
The Cup and Handle pattern is a bullish continuation pattern that resembles a cup on a candlestick chart. The cup part of the pattern is when the price gradually changes its direction from bearish to bullish, intuitively speaking, investors get hope for the performance of the security. A handle is when the price retraces slightly before it rises sharply and resumes the previous trend.
The profit target is determined by measuring the distance between the bottom of the cup and the breakout level of the pattern and increasing that distance up from the breakout point. The first target is shown in the graph. Further goals are to overcome and set a new maximum.
Control your risks and good luck to everyone.
The profit target is determined by measuring the distance between the bottom of the cup and the breakout level of the pattern and increasing that distance up from the breakout point. The first target is shown in the graph. Further goals are to overcome and set a new maximum.
Control your risks and good luck to everyone.

면책사항
해당 정보와 게시물은 금융, 투자, 트레이딩 또는 기타 유형의 조언이나 권장 사항으로 간주되지 않으며, 트레이딩뷰에서 제공하거나 보증하는 것이 아닙니다. 자세한 내용은 이용 약관을 참조하세요.
면책사항
해당 정보와 게시물은 금융, 투자, 트레이딩 또는 기타 유형의 조언이나 권장 사항으로 간주되지 않으며, 트레이딩뷰에서 제공하거나 보증하는 것이 아닙니다. 자세한 내용은 이용 약관을 참조하세요.