
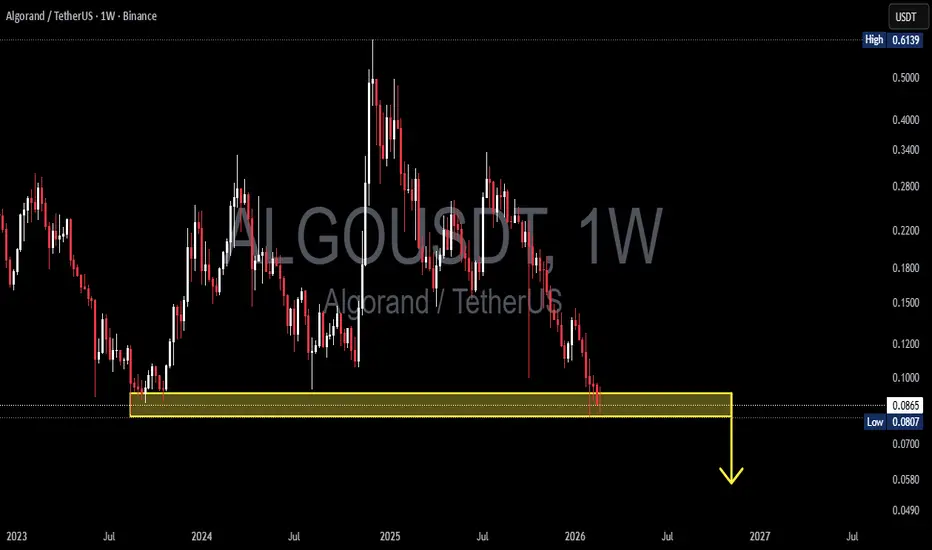
On the 1W (weekly) timeframe, ALGO/USDT remains in a long-term downtrend structure, forming consistent lower highs and lower lows since the 2025 peak.
Price has now returned to the historical demand zone at 0.092 – 0.081, which previously acted as a strong accumulation base and triggered a significant upward impulse.
This zone is a crucial level that will determine the medium–long term direction.
---
Structure & Pattern Formation
1. Primary Trend: Bearish
Market structure continues to form lower highs.
Selling pressure has dominated since failing to hold the 0.30–0.35 region.
Volume weakens during upward retracements.
2. Re-Test of Major Weekly Support
Price has revisited its previous base (2023–2024).
The 0.092 – 0.081 area is a major demand zone.
Multiple weekly wicks indicate buyer reaction.
3. Potential Pattern
If strong rejection occurs:
It could form a Double Bottom on the higher timeframe.
Or develop into a Base Accumulation Range before reversal.
If breakdown occurs:
It would confirm a major Break of Structure (BOS).
Opening room for further distribution.
---
Key Levels
Main Support:
0.092 – 0.081 (yellow block – major demand zone)
0.070 (next minor support)
0.058 – 0.050 (breakdown projection targets)
Nearest Resistance:
0.120
0.150
0.180
0.220 (previous structural breakdown level)
---
Bullish Scenario
The bullish scenario becomes valid if:
1. Price holds above 0.081.
2. Strong weekly close above 0.10–0.12.
3. A bullish engulfing or strong rejection candle appears with increasing volume.
Potential Targets:
0.120 (first resistance)
0.150
0.180
0.220 (mid-term recovery level)
If prolonged accumulation occurs, this area could mark a long-term bottom.
Additional confirmation:
Break of the last lower high.
Volume expansion during breakout.
---
Bearish Scenario
The bearish scenario activates if:
1. Strong weekly close below 0.081.
2. Clean breakdown without significant rejection wick.
3. Increasing sell volume during the drop.
Downside Targets:
0.070
0.058
0.050 (extended breakdown projection)
If this area fails, the weekly structure shifts into a long-term bearish continuation, potentially leading to capitulation.
---
Conclusion
ALGO is currently positioned at a major decision zone.
The 0.092 – 0.081 area represents:
A historical accumulation zone
Multi-touch support
A key psychological level
The reaction here will determine whether:
This becomes a bottoming & reversal phase
or
The beginning of a new breakdown toward fresh lows
Risk management is crucial, as price is sitting at a high-timeframe support.
#ALGO #ALGOUSDT #CryptoAnalysis #TechnicalAnalysis #WeeklyChart #SupportResistance #Breakdown #ReversalZone #Altcoin #CryptoTrading #MarketStructure
Price has now returned to the historical demand zone at 0.092 – 0.081, which previously acted as a strong accumulation base and triggered a significant upward impulse.
This zone is a crucial level that will determine the medium–long term direction.
---
Structure & Pattern Formation
1. Primary Trend: Bearish
Market structure continues to form lower highs.
Selling pressure has dominated since failing to hold the 0.30–0.35 region.
Volume weakens during upward retracements.
2. Re-Test of Major Weekly Support
Price has revisited its previous base (2023–2024).
The 0.092 – 0.081 area is a major demand zone.
Multiple weekly wicks indicate buyer reaction.
3. Potential Pattern
If strong rejection occurs:
It could form a Double Bottom on the higher timeframe.
Or develop into a Base Accumulation Range before reversal.
If breakdown occurs:
It would confirm a major Break of Structure (BOS).
Opening room for further distribution.
---
Key Levels
Main Support:
0.092 – 0.081 (yellow block – major demand zone)
0.070 (next minor support)
0.058 – 0.050 (breakdown projection targets)
Nearest Resistance:
0.120
0.150
0.180
0.220 (previous structural breakdown level)
---
Bullish Scenario
The bullish scenario becomes valid if:
1. Price holds above 0.081.
2. Strong weekly close above 0.10–0.12.
3. A bullish engulfing or strong rejection candle appears with increasing volume.
Potential Targets:
0.120 (first resistance)
0.150
0.180
0.220 (mid-term recovery level)
If prolonged accumulation occurs, this area could mark a long-term bottom.
Additional confirmation:
Break of the last lower high.
Volume expansion during breakout.
---
Bearish Scenario
The bearish scenario activates if:
1. Strong weekly close below 0.081.
2. Clean breakdown without significant rejection wick.
3. Increasing sell volume during the drop.
Downside Targets:
0.070
0.058
0.050 (extended breakdown projection)
If this area fails, the weekly structure shifts into a long-term bearish continuation, potentially leading to capitulation.
---
Conclusion
ALGO is currently positioned at a major decision zone.
The 0.092 – 0.081 area represents:
A historical accumulation zone
Multi-touch support
A key psychological level
The reaction here will determine whether:
This becomes a bottoming & reversal phase
or
The beginning of a new breakdown toward fresh lows
Risk management is crucial, as price is sitting at a high-timeframe support.
#ALGO #ALGOUSDT #CryptoAnalysis #TechnicalAnalysis #WeeklyChart #SupportResistance #Breakdown #ReversalZone #Altcoin #CryptoTrading #MarketStructure

✅ Get Free Signals! Join Our Telegram Channel Here: t.me/TheCryptoNuclear
✅ Twitter: twitter.com/crypto_nuclear
✅ Join Bybit : partner.bybit.com/b/nuclearvip
✅ Benefits : Lifetime Trading Fee Discount -50%
✅ Twitter: twitter.com/crypto_nuclear
✅ Join Bybit : partner.bybit.com/b/nuclearvip
✅ Benefits : Lifetime Trading Fee Discount -50%
면책사항
해당 정보와 게시물은 금융, 투자, 트레이딩 또는 기타 유형의 조언이나 권장 사항으로 간주되지 않으며, 트레이딩뷰에서 제공하거나 보증하는 것이 아닙니다. 자세한 내용은 이용 약관을 참조하세요.
✅ Get Free Signals! Join Our Telegram Channel Here: t.me/TheCryptoNuclear
✅ Twitter: twitter.com/crypto_nuclear
✅ Join Bybit : partner.bybit.com/b/nuclearvip
✅ Benefits : Lifetime Trading Fee Discount -50%
✅ Twitter: twitter.com/crypto_nuclear
✅ Join Bybit : partner.bybit.com/b/nuclearvip
✅ Benefits : Lifetime Trading Fee Discount -50%
면책사항
해당 정보와 게시물은 금융, 투자, 트레이딩 또는 기타 유형의 조언이나 권장 사항으로 간주되지 않으며, 트레이딩뷰에서 제공하거나 보증하는 것이 아닙니다. 자세한 내용은 이용 약관을 참조하세요.