
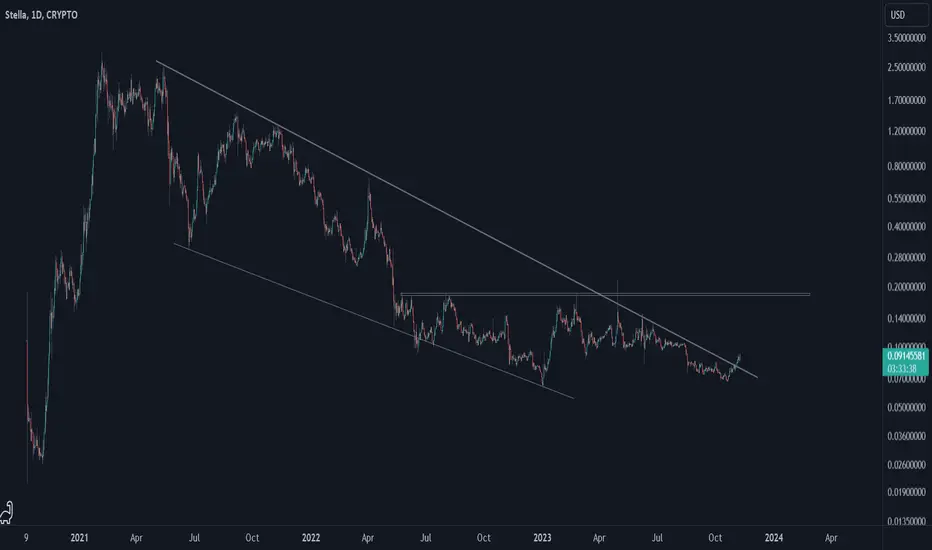
Stella's chart is straightforward; a sharp upward move followed by a lengthy correction wave unfolded in a big descending triangle pattern. Recently, ALPHA broke the major downtrend line. Let's see how up Stella can go.
노트
Alpha is going crazy!
노트
So, after Alpha frenzy ended, price came down. Alpha need to break this major horizontal resistance area in order to confirm reversal. Let's see what happens.
노트
So, Alpha couldn't break the major horizontal resistance area, then went down. It seems Alpha has made an inverted wedge/triangle pattern. Recently, Alpha reached the bottom and then broke the downtrend line. Let's see if Alpha can reach the inverted pattern's top or even break it.
액티브 트레이드
So, Alpha is going up toward the inverted wedge's upper line. Let's see what happens.

면책사항
해당 정보와 게시물은 금융, 투자, 트레이딩 또는 기타 유형의 조언이나 권장 사항으로 간주되지 않으며, 트레이딩뷰에서 제공하거나 보증하는 것이 아닙니다. 자세한 내용은 이용 약관을 참조하세요.
면책사항
해당 정보와 게시물은 금융, 투자, 트레이딩 또는 기타 유형의 조언이나 권장 사항으로 간주되지 않으며, 트레이딩뷰에서 제공하거나 보증하는 것이 아닙니다. 자세한 내용은 이용 약관을 참조하세요.