 AMC
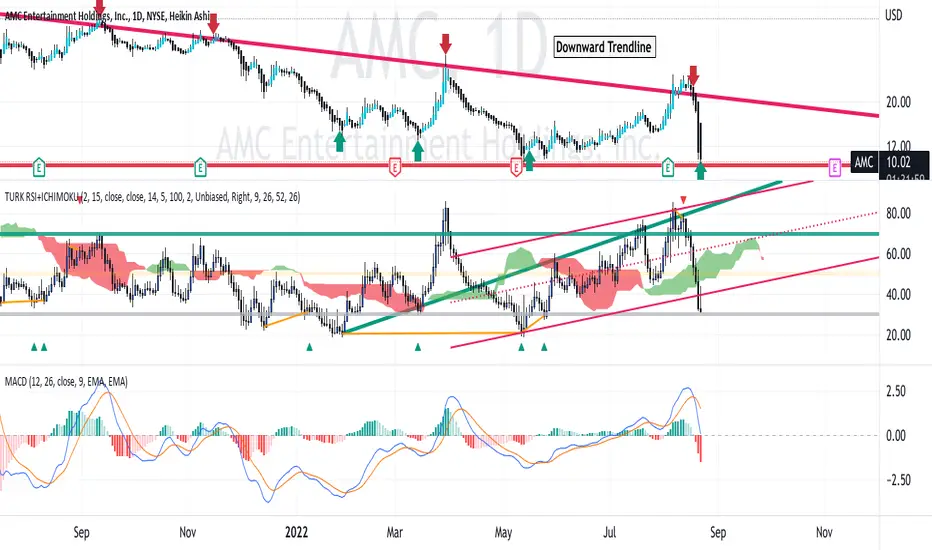
AMCAMC since the parabolic move May- June 2021
has been in a flat bottom triangle pattern with "touches"
on both the support trendline and the upper resistance trendline.
In the past several trading days, with the volatility of the APE special class dividend stock,
AMC has gone up to the upper line and now is now again at the $10 range.
The MACD and Relative Strength are weak. This is consistent with buying weakness
and low then selling above that.
While waiting for a true breakout of the triangle, I see a long swing setup
as buying the bottom at $10 and observing for a rise to the upper trendline
with a target of $19. I will set a stop loss below the triangle at $9.50
This would offer a reward on risk of 19X. I well realize that market
catalysts can trump the pattern anytime and assume that risk.
Go Apes !
액티브 트레이드
AMC up 3% from low of $9.31
면책사항
해당 정보와 게시물은 금융, 투자, 트레이딩 또는 기타 유형의 조언이나 권장 사항으로 간주되지 않으며, 트레이딩뷰에서 제공하거나 보증하는 것이 아닙니다. 자세한 내용은 이용 약관을 참조하세요.
면책사항
해당 정보와 게시물은 금융, 투자, 트레이딩 또는 기타 유형의 조언이나 권장 사항으로 간주되지 않으며, 트레이딩뷰에서 제공하거나 보증하는 것이 아닙니다. 자세한 내용은 이용 약관을 참조하세요.