
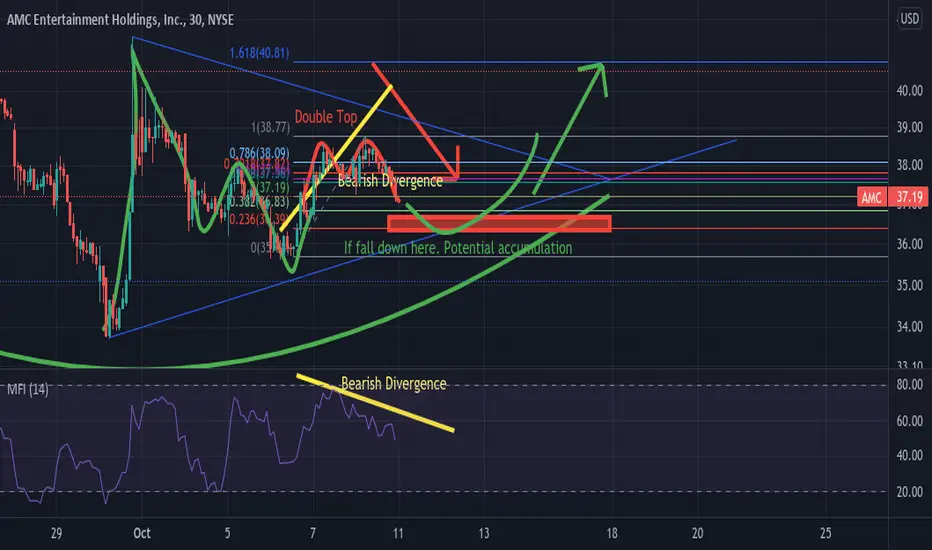
What I thought could be seen a breakout today turns what to bearish double top. What I notice yesterday was a bearish divergence in the 15 min chart today the 30 minute chart confirms it. As the price heads higher the MFI indicators highs drops. The key levels price I will be looking at is $36.30-$36.70. If that key support is hold what I seen is probably an extension of an Inverse Right Shoulder. Meaning that there is still potential of the upside next week. And if its it true there's a potential bear trap at the $36 range. If it drops lower $36. I will readjust.

면책사항
해당 정보와 게시물은 금융, 투자, 트레이딩 또는 기타 유형의 조언이나 권장 사항으로 간주되지 않으며, 트레이딩뷰에서 제공하거나 보증하는 것이 아닙니다. 자세한 내용은 이용 약관을 참조하세요.
면책사항
해당 정보와 게시물은 금융, 투자, 트레이딩 또는 기타 유형의 조언이나 권장 사항으로 간주되지 않으며, 트레이딩뷰에서 제공하거나 보증하는 것이 아닙니다. 자세한 내용은 이용 약관을 참조하세요.