
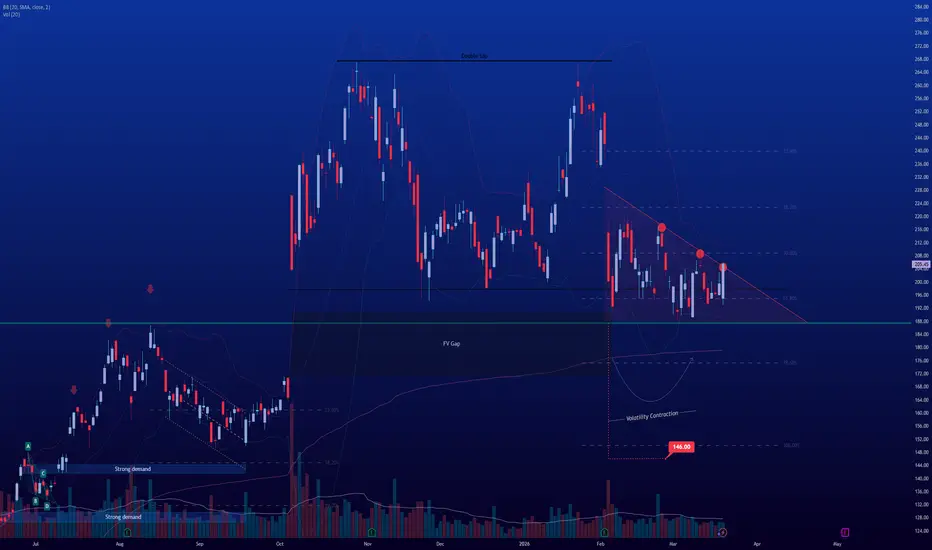
Advanced Micro Devices (AMD) is currently displaying a high-probability bearish setup combining two powerful technical patterns.
First, the stock has formed a clear double top, signaling potential exhaustion after an extended move higher. Price is now trading near the neckline, which is a critical level to watch for confirmation of downside continuation.
Zooming in, we can also identify a descending triangle forming right at this key area. This adds confluence to the bearish thesis:
Two clean rejection points along the descending trendline
Price currently retesting the upper boundary of the triangle
Clear volatility contraction as price compresses toward the apex
Declining volume, supporting the likelihood of an imminent breakout
This type of price action reflects supply stepping in progressively lower, while demand holds temporarily at support — a structure that typically resolves to the downside.
If the breakdown occurs with expansion in volume, it would confirm the pattern and trigger the measured move.
Trade Idea:
Bias: Bearish
Trigger: Breakdown below triangle support / neckline
Confirmation: Volume expansion on breakdown
Target (Measured Move): 146
Key Insight:
The combination of a higher timeframe reversal pattern (double top) with a lower timeframe continuation pattern (descending triangle) increases the probability of a downside move. Keep an eye on the breakout — this setup looks close to resolution.
First, the stock has formed a clear double top, signaling potential exhaustion after an extended move higher. Price is now trading near the neckline, which is a critical level to watch for confirmation of downside continuation.
Zooming in, we can also identify a descending triangle forming right at this key area. This adds confluence to the bearish thesis:
Two clean rejection points along the descending trendline
Price currently retesting the upper boundary of the triangle
Clear volatility contraction as price compresses toward the apex
Declining volume, supporting the likelihood of an imminent breakout
This type of price action reflects supply stepping in progressively lower, while demand holds temporarily at support — a structure that typically resolves to the downside.
If the breakdown occurs with expansion in volume, it would confirm the pattern and trigger the measured move.
Trade Idea:
Bias: Bearish
Trigger: Breakdown below triangle support / neckline
Confirmation: Volume expansion on breakdown
Target (Measured Move): 146
Key Insight:
The combination of a higher timeframe reversal pattern (double top) with a lower timeframe continuation pattern (descending triangle) increases the probability of a downside move. Keep an eye on the breakout — this setup looks close to resolution.

면책사항
해당 정보와 게시물은 금융, 투자, 트레이딩 또는 기타 유형의 조언이나 권장 사항으로 간주되지 않으며, 트레이딩뷰에서 제공하거나 보증하는 것이 아닙니다. 자세한 내용은 이용 약관을 참조하세요.
면책사항
해당 정보와 게시물은 금융, 투자, 트레이딩 또는 기타 유형의 조언이나 권장 사항으로 간주되지 않으며, 트레이딩뷰에서 제공하거나 보증하는 것이 아닙니다. 자세한 내용은 이용 약관을 참조하세요.