
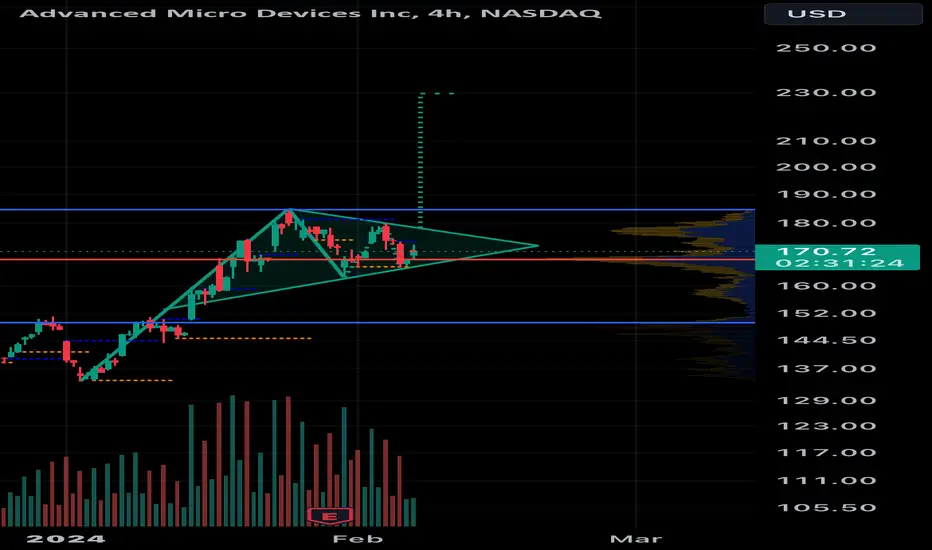
AMD Chart Analysis: Potential Bullish Signal on 4-Hour Timeframe
I've observed a potential bullish pennant pattern forming on the 4-hour chart for AMD. This pattern often precedes price breakouts, with a target of $230 based on standard technical analysis measurements. However, it's crucial to remember:
Technical analysis is not a guarantee of future results: Past performance doesn't predict future outcomes. Consider this pattern as a possibility, not a certainty.
Thorough research is essential: Conduct your own research, analyze fundamental factors, and understand the inherent risks involved before making any investment decisions.
Risk management is paramount: Always prioritize risk management strategies like stop-loss orders, regardless of technical signals or price targets.
I've observed a potential bullish pennant pattern forming on the 4-hour chart for AMD. This pattern often precedes price breakouts, with a target of $230 based on standard technical analysis measurements. However, it's crucial to remember:
Technical analysis is not a guarantee of future results: Past performance doesn't predict future outcomes. Consider this pattern as a possibility, not a certainty.
Thorough research is essential: Conduct your own research, analyze fundamental factors, and understand the inherent risks involved before making any investment decisions.
Risk management is paramount: Always prioritize risk management strategies like stop-loss orders, regardless of technical signals or price targets.
액티브 트레이드
액티브 트레이드

USDT: 0xd3787d843Cf915E5475119459B34b6429827c297
면책사항
해당 정보와 게시물은 금융, 투자, 트레이딩 또는 기타 유형의 조언이나 권장 사항으로 간주되지 않으며, 트레이딩뷰에서 제공하거나 보증하는 것이 아닙니다. 자세한 내용은 이용 약관을 참조하세요.
USDT: 0xd3787d843Cf915E5475119459B34b6429827c297
면책사항
해당 정보와 게시물은 금융, 투자, 트레이딩 또는 기타 유형의 조언이나 권장 사항으로 간주되지 않으며, 트레이딩뷰에서 제공하거나 보증하는 것이 아닙니다. 자세한 내용은 이용 약관을 참조하세요.